Putting it all Together
Let's recap what we have done:
- We have a Readout program for our experiment that produces reasonably
self describing data.
This program, according to Illustration 1 must be run in the spdaq system
attached to the hardware of our experiment.
- We have a tailored SpecTcl that can analyze the data for this experiment, and
a configuration file that will produce an initial set of histograms.
In order to put this all together in to a working experiment, we need to:
- [ ]Indicate to the software which staging area we will use.
- [ ]Arrange to have Readout run in the appropriate Spdaq system.
- [ ]Arrange for event recording to be done as required by the experiment.
- [ ]Run SpecTcl and connect it to the on line data source.
- [ ]Arrange for data recorded to disk to get spooled out to tape before we
run out of disk space.
- [ ]Setup a scaler display window.
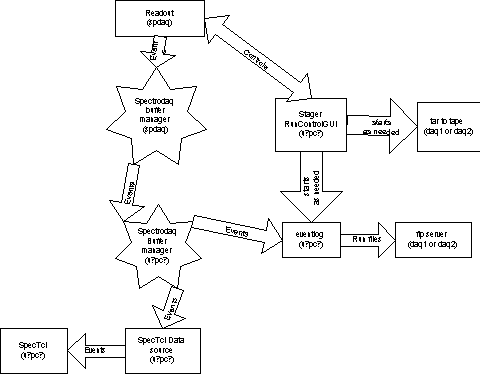
The figure below shows the logical organization of the software and the physical
allocation of this software to computers in the data acquisition system.
The main points at which you will interact with the system are with the
Stager/RunControl GUI and SpecTcl.
Integrated system block diagram
Not shown on this diagram is a standard file system organization
for data stored by the experiment that is created and enforced by
the Stager/RunControl GUI software.
A complete description of this organization is at:
http://docs.nscl.msu.edu/daq/overview,
click on "Event Logs."
Report documentation errors to
Ron Fox
(fox@nscl.msu.edu)or
NSCL's Bugzilla page


