QtScope Manual
Table of Contents
- Introduction
- Before You Start
- Launching QtScope and Environment Variables
- Logging: The qtscope.log File and Log Levels
- Booting the System
- GUI Overview
- Exiting QtScope
- Reference: Parameter Names
- Date
- 7/17/23 - Initial QtScope manual for FRIBDAQ 12.0.
- 7/31/26 - ASC: updated for new features in FRIBDAQ 12.2.
Introduction
- QtScope is the slow-control graphical user interface (GUI) for configuring the digital signal processing (DSP) parameters of XIA Pixie-16 digitizers in an FRIBDAQ DDAS system. It is the supported replacement for the nscope program, available starting with NSCLDAQ 12.0.
- This tutorial assumes no prior experience with QtScope. It walks through launching the program, booting a crate, using the interface, and it explains what each DSP setting does. Later sections and the reference tables at the end go into enough depth for expert users who need the exact parameter names and register bit meanings.
QtScope Feature Set
- QtScope was written using a set of Python bindings for Qt5 called PyQt5 and takes advantage of both the GUI design capabilities of Qt as well as familiar Python tools like matplotlib and NumPy. Communication with the Pixie-16 modules via the XIA API is implemented using the Python ctypes foreign function library. QtScope implements a model-view-controller (MVC) architecture for user interaction with the Pixie-16 hardware and manages the DSP parameters internally using a Python dataframe. The viewer never calls the hardware, and lifecycle operations (boot/configure, save/load, exit) are synchronous in the main thread by design.
- QtScope provides a number of useful features for configuring DDAS systems, including:
- Configuration of multiple modules in a single crate.
- Control over all parameters for the energy and trigger filters.
- Control over the CSRA and CSRB registers and the ability to configure individual register bits.
- Limited control over the coincidence settings of the modules in the crate.
- Automatic baseline calculations.
- Histogram acquisition for a single module at a time.
- Trace and trapezoidal filter visualization.
- Reading and writing DSP settings files.
- QtScope also offers a number of quality-of-life and design improvements over nscope:
- Adoption of common Python libraries for numerical methods.
- A flexible and extensible GUI written in PyQt5.
- Improved UI blocking.
- Unified interfaces for configuring channel-level and module-level DSP parameters.
- Pre-defined crate configurations for common single- and multi-crate setups.
- Event logging for debugging/troubleshooting, described in more detail below.
Before You Start
- QtScope is designed to run on a machine physically connected to Pixie-16 hardware – at FRIB this is typically an
spdaqcomputer – with the PXI crate powered on and containing at least one Pixie-16 card.
- QtScope must be launched from a directory that contains two configuration files:
- cfgPixie16.txt – describes the crate: which slots contain modules, the DSP settings (
.set/.json) file to boot with, and, optionally, firmware or settings file overrides. - modevtlen.txt – the event length (in 32-bit words) for each module. This must match how you configure the modules. Enabling trace output, QDC sums, or energy sums (see Channel DSP Settings) adds words to each event, and those extra words must be reflected here. If the event lengths are wrong, the DDAS readout program will be in an error state.
- cfgPixie16.txt – describes the crate: which slots contain modules, the DSP settings (
- If you have never set up a DDAS system, work through a system-setup guide first; this tutorial covers using QtScope, not setting up and configuring a new crate from scratch.
- Note
- QtScope has an offline mode that runs the entire GUI against a synthetic data generator with no hardware attached (see Launching QtScope and Environment Variables). This is the easiest way to explore the interface described below.
Launching QtScope and Environment Variables
- First, configure the NSCLDAQ environment by sourcing its setup script (adjust the version for your installation):
. /usr/opt/daq/12.2-009/daqsetup.bash
This setsDAQBINto the directory containing the QtScope executable. Launch QtScope with:$DAQBIN/qtscope
Environment Variables
- QtScope reads several environment variables at startup. Set them (typically with
export NAME=value) before launching. Note that environment variables must be set in the environment where QtScope is launched i.e., inside a container.
| Variable | Required? | Effect |
|---|---|---|
DAQROOT | Yes | Set by daqsetup.bash. QtScope refuses to start if it is unset, and exits with an error telling you to source the setup script. It must point at a valid NSCLDAQ install (QtScope looks for its installed Python files in $DAQROOT/ddas/qtscope). |
QTSCOPE_OFFLINE | No (default 0) | Set to 1 to run in offline mode: the modules are "booted" without hardware and all trace/histogram/baseline data is produced by an internal synthetic data generator. Use this for demos, training, and GUI testing. |
QTSCOPE_LOG_LEVEL | No (default info) | Minimum severity written to the log file. See Logging: The qtscope.log File and Log Levels. |
FIRMWARE_FILE | No | If set, boot uses this firmware definition file instead of the managed firmware. Normally leave this variable unset. |
DDAS_BOOT_WHEN_REQUESTED | No | If set to any value (even empty), boot performs a settings-only boot rather than a full firmware boot. Because C's getenv returns non-null for a variable that merely exists, defining this variable – not its contents – is what enables settings-only boot. |
Offline Mode Example
export QTSCOPE_OFFLINE=1
$DAQBIN/qtscope
When offline mode is active, QtScope prints a banner to the terminal:----------------------------------- QtScope running in offline mode!!! -----------------------------------
Logging: The qtscope.log File and Log Levels
- QtScope records what it is doing – informational messages, warnings, and errors – to a plain-text log file named qtscope.log in the directory you launched it from. This file is the first place to look when something goes wrong; boot failures, hardware errors, and unexpected crashes all leave a trace here.
Log Levels
- Every message has a severity. The log level sets the minimum severity that gets written; anything less severe is discarded. From least to most severe:
| Level | Meaning |
|---|---|
debug | Very detailed internal activity (per-parameter reads/writes, filter calculations). Verbose. |
info | Normal milestones (boot succeeded, settings saved, run started). Default. |
warning | Something unexpected but non-fatal. |
error | An operation failed. |
critical | A severe failure, including any otherwise-uncaught program error. |
- Choosing
debugwritesdebugand everything above it; choosingerrorwrites onlyerrorandcritical. The default, whenQTSCOPE_LOG_LEVELis unset, isinfo.
Setting the Level
- Set the environment variable before launching. The value is case-insensitive:
export QTSCOPE_LOG_LEVEL=debug
$DAQBIN/qtscope
The level is read and applied once, at startup. To change it, exit, re-export, and relaunch.
- Attention
- If you set
QTSCOPE_LOG_LEVELto a value that is not one of the five names above, QtScope will not start with a broken logger: it reports the bad value, printsFailed to configure logger. See qtscope.log for details.to the terminal, and exits. Fix the value and relaunch.
What the Log Looks Like
- Each line is formatted as:
LEVELNAME - YYYY-MM-DD HH:MM:SS,mmm: message text
for example:INFO - 2026-07-30 09:15:02,481: System boot successful
Details for Experts
- QtScope uses a single application-owned logger named
qtscope_logger.main.pyattaches aFileHandler(toqtscope.log) directly to the logger it and setspropagate = False, so QtScope's logging is fully self-contained and never goes through Python's root logger. A last-resort hook (sys.excepthook) catches any exception that escapes all other handling and writes it to the log atcriticallevel (with a full traceback) before the process exits – hopefully no failure mode can vanish without a record. ACtrl-C(KeyboardInterrupt) is treated as a normal quit and is not logged as a crash. Hardware/API failures are logged once, at their origin, with a reason string retrieved from the C++ layer; higher layers transport or present the error rather than re-logging it.
Booting the System
- When QtScope first opens, almost every control is disabled. Only [Boot system], [About], and [Exit] on the system toolbar are active. This is deliberate: until firmware and DSP parameters are loaded onto the modules ("booting"), there is nothing to configure or acquire.
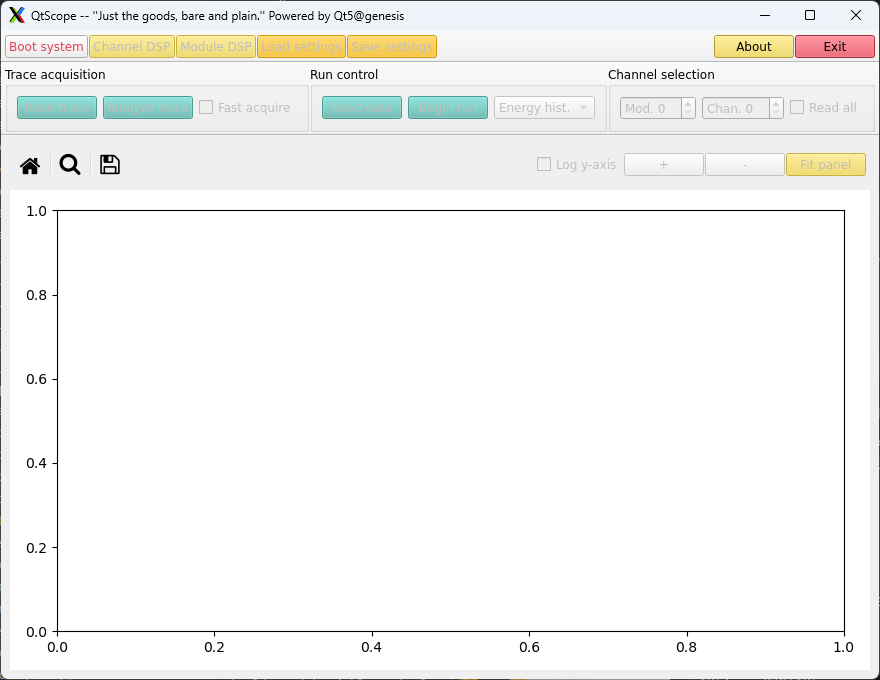
The QtScope GUI state on startup. Note that most GUI elements besides [Boot system], [About] and [Exit] on the system toolbar are disabled.
- Click [Boot system] (left end of the system toolbar). QtScope loads firmware and the DSP settings from the file specified in
cfgPixie16.txtto every module in the crate. Progress is printed to the terminal, for example:------------------------ Initializing PXI access... System initialized successfully. Found Pixie module #0, Rev = 15, S/N = 250, Bits = 16, MSPS = 250 Found Pixie module #1, Rev = 15, S/N = 1000, Bits = 14, MSPS = 500 Found Pixie module #2, Rev = 15, S/N = 1001, Bits = 14, MSPS = 250 Found Pixie module #3, Rev = 17, S/N = 1002, Bits = 14, MSPS = 250 ----- Module 0 ----- ADC resolution : 16 ADC MSPS : 250 Number : 0 Channels : 16 Revision : 15 Serial No. : 250 Slot : 2 FW revision : x.y.z FW tag : 15-250-16 FW type : user sys: .../sys.bin fippi: .../fippi.bin dsp: .../dsp.ldr var: .../dsp.var DSP settings: .../crate_1.json ...
On success you will see:All modules ok QtScope system configuration complete!
and the [Boot system] button turns green and changes its label to [Booted]. The rest of the toolbars become enabled. The booted button is disabled – clicking it again does nothing.
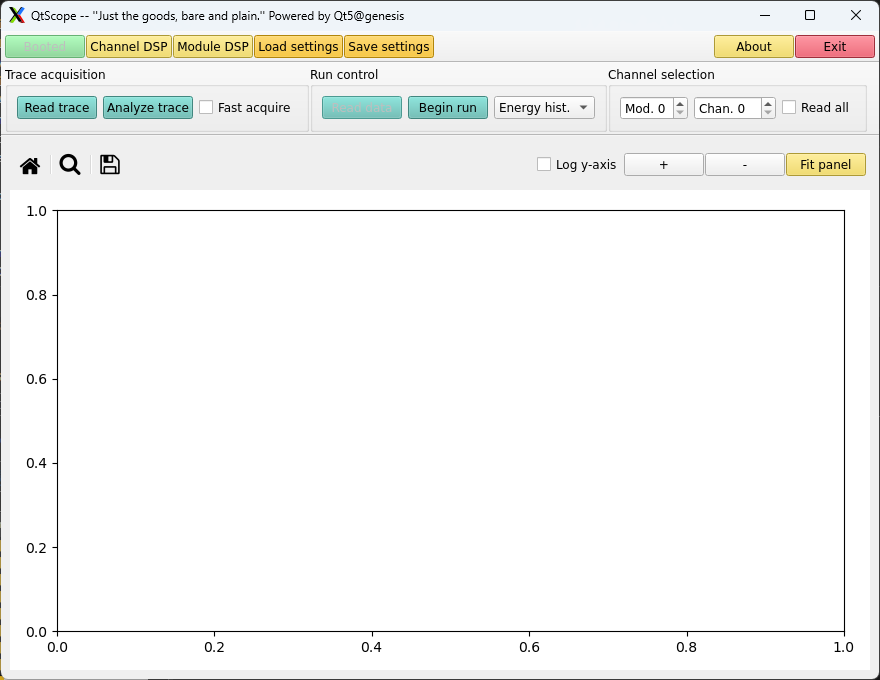
The QtScope GUI state after a successful system boot. Note that the button previously displaying [Boot system] is now green, disabled, and reads [Booted]. The remaining GUI elements are enabled upon a successful boot.
- If booting fails – most commonly because
cfgPixie16.txtormodevtlen.txtis missing or malformed – QtScope prints an error to the terminal and the log, does not crash, and leaves the system unbooted. Fix the problem (for example, copy a correctcfgPixie16.txtinto the launch directory) and click [Boot system] again; the configuration files are re-read on every attempt. The [Exit] button is always available.
- Note
- QtScope numbers modules with an internal, zero-indexed counter that is not the PXI slot number. If modules occupy slots 2 and 4, the slot-2 module is "Mod. 0" and the slot-4 module is "Mod. 1" throughout the GUI.
-
By default, booting performs a full boot (firmware + settings). If
DDAS_BOOT_WHEN_REQUESTEDis defined in the environment, a faster settings-only boot is performed instead (see Environment Variables).
GUI Overview
- After booting, the main window has three active horizontal toolbars and a central plot canvas:
- The System Toolbar – boot, open the DSP configuration windows, save/load settings files, About, and Exit.
- The Acquisition Toolbar – choose a module/channel, acquire and display ADC traces, and start/stop histogram and baseline runs.
- The Plot Toolbar and Fitting – zoom, save the canvas as an image, toggle log scaling, and open the fit panel.
- Canvas – the matplotlib area where traces, histograms, and filter outputs are drawn.
- Two separate popup windows hold the DSP settings themselves:
- Channel DSP Settings – per-channel settings (trigger settings, energy filter, CFD, CSRA, ...).
- Module DSP Settings – per-module settings (crate ID, CSRB, trigger configuration registers).
- A general convention: controls that cannot be used in the current state are disabled (greyed out) rather than hidden. While a run is active, for example, the trace-acquisition buttons are disabled; clicking a disabled control does nothing.
The System Toolbar

The QtScope system toolbar.
- The system toolbar manages the overall state of the system. From left to right:
| Button | Color | What it does |
|---|---|---|
| Boot system | red text, then green "Booted" | Loads firmware + DSP settings onto all modules. Disabled after a successful boot. See Booting the System. |
| Channel DSP | yellow | Opens the Channel DSP configuration window. See Channel DSP Settings. |
| Module DSP | yellow | Opens the Module DSP configuration window. See Module DSP Settings. |
| Load settings | orange | Opens a file dialog to load a DSP settings file onto the modules. |
| Save settings | orange | Opens a file dialog to save the current DSP settings to a file. |
| About | yellow | Shows QtScope version, author, and Qt open-source license/source links. Always enabled. |
| Exit | red | Cleanly shuts down and releases the modules. Always enabled. See Exiting QtScope. |
- The [Channel DSP], [Module DSP], [Load settings], and [Save settings] buttons are enabled only after a successful boot. [About] and [Exit] are always enabled.
Load and Save Settings
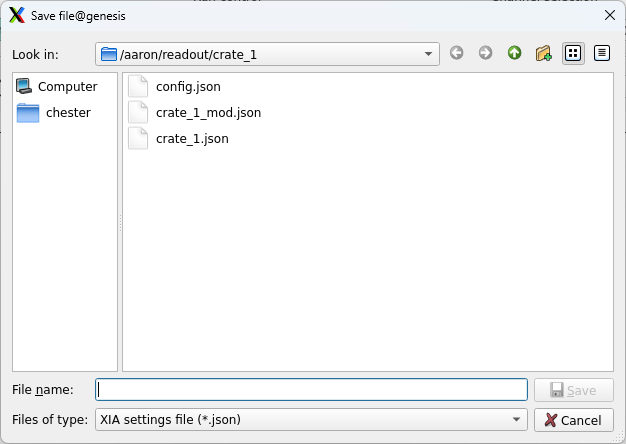
The QtScope save dialog window opened when the [Save settings] button is clicked.
- Both buttons open a file dialog. Type a file name or pick an existing file with the browser. Saving over an existing file overwrites it.
- The settings file format depends on the XIA API version QtScope/NSCLDAQ were built against:
- XIA API v2 – a binary file (not human-readable).
- XIA API v3+ – a JSON file (human-readable). For FRIBDAQ versions 12.2 and later, the settings file must be JSON format.
- In a JSON settings file, parameter values are stored in the modules' internal units – e.g. filter risetimes are in ADC samples, not microseconds – so they will not look the same as the values shown on the GUI.
- Loading a settings file after booting writes the new parameters to the modules and refreshes the GUI. If a load fails, QtScope reports the error and leaves the displayed values unchanged rather than showing a half-updated state.
The Acquisition Toolbar

The QtScope acquisition toolbar.
- The acquisition toolbar lets you inspect data acquired with your current DSP settings. It has three group boxes: Trace acquisition, Run control, and Channel selection.
Trace Acquisition
- [Read trace] – acquires and plots an ADC trace from the selected channel (or all channels, if Read all is checked). QtScope repeatedly reacquires until it finds what it thinks is a vaild trace or hits its reacquire limit. Note that this is not a triggered trace acquisition as you would have when running a production readout program. If no validated trace is found, the last acquired trace is displayed. Displayed traces are generally 8192 samples at 60 ns/sample; the 60 ns display sampling is a fixed limitation of the acquisition API and does not apply to trace data written to disk during a real run.
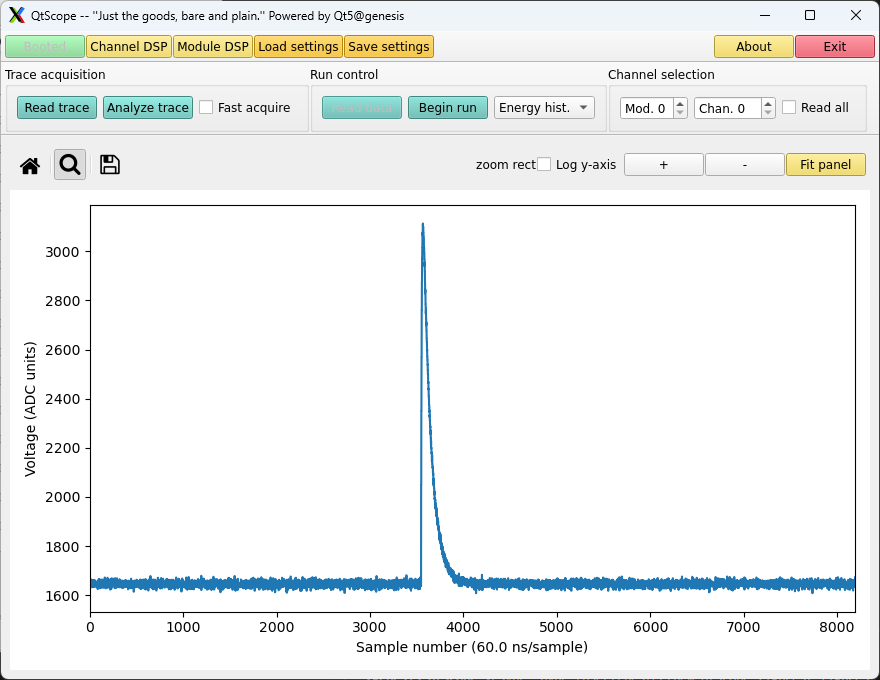 QtScope following trace acquisition. The acquired trace is displayed on the canvas.
 - [ ] Fast acquire – when checked, [Read trace] skips the validation search and shows whatever it reads on the first try. This may be a baseline with no signal. Useful when you just want to see the raw input, or when there is no pulse to validate.
- [Analyze trace] – splits the canvas into three stacked sub-plots showing, top to bottom, the trace, the timing (fast) filter + CFD output, and the energy (slow) filter output, all computed from the current DSP settings. This is the key tool for tuning filter parameters: you can see the effect of your risetime/gap/threshold choices on simulated filter outputs without starting a run. If no trace is displayed, QtScope acquires one first. Analysis is always single-channel.
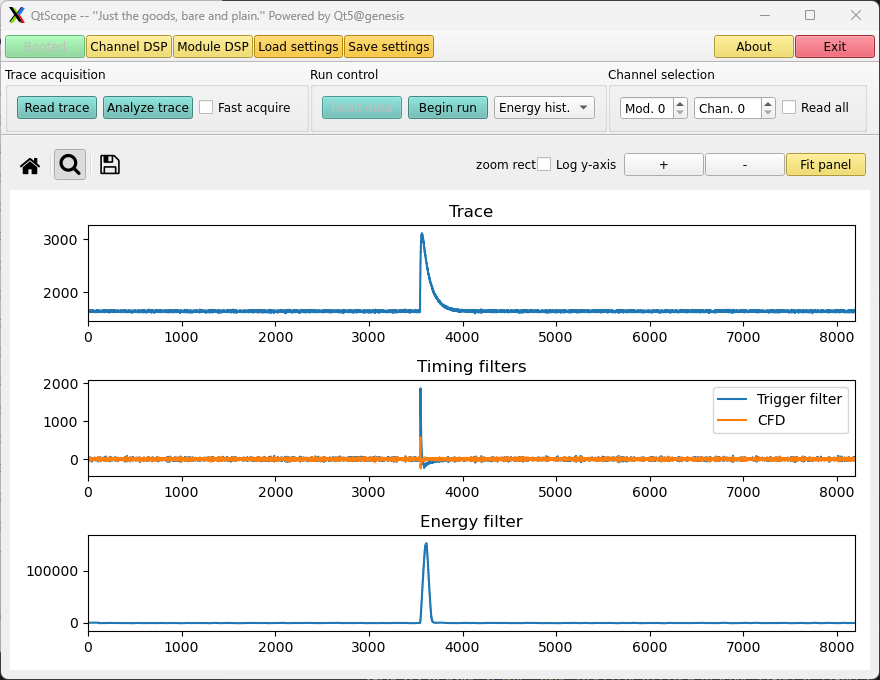 An analyzed trace is shown on the QtScope canvas. Shown from top to bottom are the trace data, the fast filter and CFD, and the energy filter output.
- [Read trace] – acquires and plots an ADC trace from the selected channel (or all channels, if Read all is checked). QtScope repeatedly reacquires until it finds what it thinks is a vaild trace or hits its reacquire limit. Note that this is not a triggered trace acquisition as you would have when running a production readout program. If no validated trace is found, the last acquired trace is displayed. Displayed traces are generally 8192 samples at 60 ns/sample; the 60 ns display sampling is a fixed limitation of the acquisition API and does not apply to trace data written to disk during a real run.
- Trace-acquisition controls are disabled while a run is active.
Run Control
- Run type (combo box) – selects what a run acquires:
- Energy hist. – the onboard energy (MCA) histogram (default).
- Baseline – the channel baseline distribution. Not supported for 32-channel modules.
- [Begin run] / [End run] – the same button toggles. Click [Begin run] to start a run in the selected module; it becomes [End run] and the terminal prints e.g.
Beginning histogram run in Mod. 0. While a run is active, the module selector and trace controls are disabled and [Read data] is enabled. - [Read data] – reads the current run data from the module and draws it on the canvas. You can read repeatedly during a run to watch a histogram fill. Enabled only while a run is active.
- Run type (combo box) – selects what a run acquires:
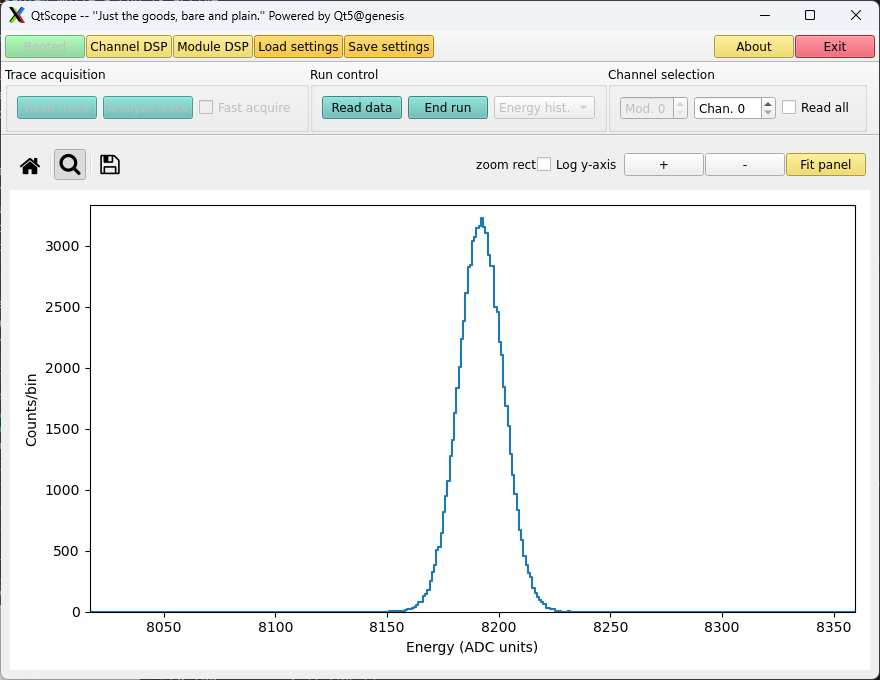
QtScope while a run is active with an energy spectrum shown on the canvas. Note that operations which are not permitted during a run, such as acquiring an ADC trace, are disabled on the GUI.
- When you click [End run], the run stops and QtScope returns to the idle state (
Ended histogram run in Mod. 0). For energy histogram runs, per-channel run statistics are printed to the terminal:Module 0 channel 0 input 534.613 output 534.613 livetime 11.932 runtime 11.932 Module 0 channel 1 input 0 output 0 livetime 11.932 runtime 11.932 ...
where input = triggers/second, output = accepted triggers/second, livetime = active acquisition time in seconds, and runtime = total elapsed run time in seconds.
Channel Selection
- Mod. (spin box) – the module to read from (0-indexed).
- Chan. (spin box) – the channel on that module (0-indexed). Its range follows the selected module (the crate may mix 16- and 32-channel boards).
- [ ] Read all – when checked, operations read/plot every channel on the selected module and tile them on the canvas, instead of the single selected channel. Reading and rendering all channels takes noticeably longer – be patient.
The Plot Toolbar and Fitting

The QtScope plot toolbar.
- The plot toolbar controls the canvas display and provides curve fitting. It combines a few standard matplotlib navigation buttons with QtScope-specific controls (the matplotlib Back/Forward/Subplots/Pan/Customize buttons are removed):
| Control | What it does |
|---|---|
| Home (house icon) | Reset the canvas to its default axis limits. |
| Zoom-to-rectangle (magnifying glass) | Drag a rectangle to zoom into a region. |
| Save (floppy-disk icon) | Open a dialog to save the canvas to an image file (PNG, PDF, SVG, ...). |
| + / - | Zoom the current plot in / out by a step. |
| [ ] Log y-axis | Redraw all plots with a logarithmic y-axis. |
| [Fit panel] (yellow) | Open the fitting panel (below). |
The Fit Panel
- Click [Fit panel] to open a popup for fitting the displayed data. Fitting operates on a single plotted data set (one subplot on the canvas).
- Fit function (combo box) – choose the function. QtScope ships four:
| Name | Form | Data model |
|---|---|---|
| Exponential | p0*exp(p1*x) + p2 | least-squares (for trace-like data) |
| Gaussian | p0*exp(-(x-p1)^2 / (2*p2^2)) | Poisson (for counts) |
| Gaussian + linear | Gaussian + p3 + p4*x | Poisson |
| Gaussian + quadratic | Gaussian + p3 + p4*x + p5*x^2 | Poisson |
- The chosen function's formula is shown beneath the selector. The parameters
p[0], p[1], ...in the formula correspond to the p0, p1, ... input fields.- Min x / Max x – the fit range. If left blank, QtScope uses the current axis limits (so you can "zoom to the peak" and fit just that region). These fields accept non-negative integers only (they map to data indices).
- p0 ... p5 – initial parameter guesses. These accept any numeric value. If left blank, QtScope tries to estimate parameter values from the data.
- [Fit] – performs the fit and draws the best-fit curve (red) on the canvas. Multiple fits superimpose. Best-fit values and their uncertainties are printed in the Fit output box as
p[i]: value +/- error. - [Clear] – remove all fitted curves and clear the Fit output box.
- [Cancel] – close the fit panel.
- If you type a non-numeric value into any field and click [Fit], QtScope shows a warning dialog ("Fit parameters and range limits must be numeric.") and does nothing.
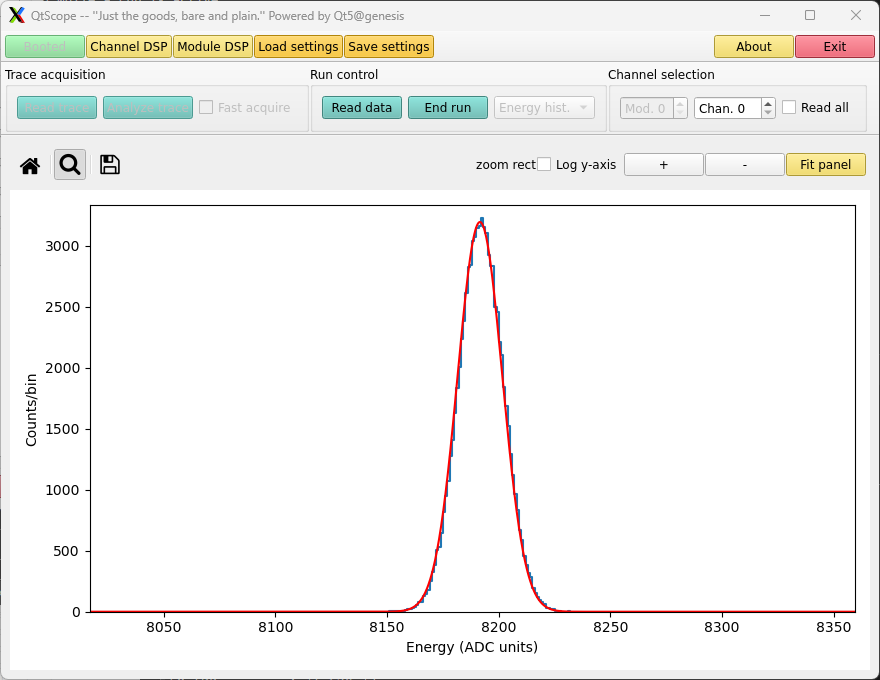
The QtScope canvas showing a peak fit with the Gaussian fitting function following a histogram data run.
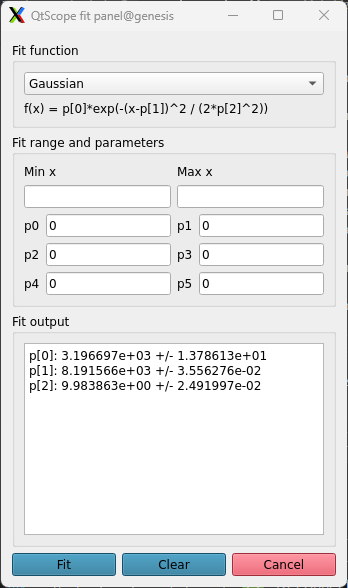
The fit panel after fitting a Gaussian model function to a peak. The best-fit parameters and estimations for the parameter error at one standard deviation are shown in the fit panel dialog box.
- Note
- For experts: histogram fits minimize a Poisson negative log-likelihood; the Exponential fit uses an ordinary least-squares objective. Reported uncertainties are the square roots of the diagonal of the optimizer's inverse-Hessian, with the least-squares path scaled by the residual variance. These are parabolic estimates, adequate for guidance; they are not a substitute for a full covariance analysis.
Channel DSP Settings
- Click [Channel DSP] on the system toolbar to open the channel DSP configuration window. Channel DSP parameters apply to individual channels on a module (e.g. the fast-filter settings which control the trigger). They are organized as nested tabs: a top-level tab per module (Mod. 0, Mod. 1, ...), and within each module a set of function tabs (AnalogSignal, TriggerFilter, ...). Each row within a tab is one channel, labeled by its zero-indexed channel number.
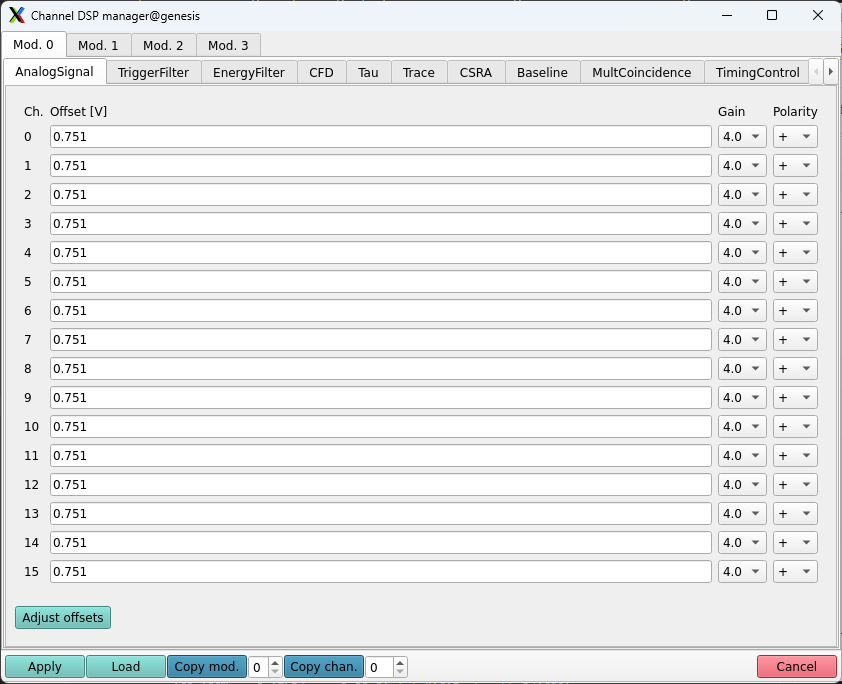
The channel DSP popup window displayed when clicking the [Channel DSP] button. The tab controlling the analog signal properties and DC offset on module 0 is selected. Additional tabs at the top allow the user to select other modules. The channel DSP toolbar is visible on the bottom of the figure.
The Channel DSP Toolbar
- Every channel tab shares a bottom toolbar:
| Button | Action |
|---|---|
| [Apply] | Write the values shown on the current tab to every channel on the current module. |
| [Load] | Read the current tab's parameters back from the module and display them. |
| [Copy mod.] + spin box | Copy all displayed parameters from another module (chosen in the spin box) into the current module's data. Only allowed between modules with the same channel count. |
| [Copy chan.] + spin box | Copy the parameters from one channel (chosen in the spin box) to all channels on the current module. (Hidden on the MultCoincidence tab.) |
| [Cancel] | Close the Channel DSP window. |
- Attention
- The Copy buttons only modify QtScope's internal copy of the parameters (a Python dataframe). Nothing is written to hardware until you click [Apply].
- Note
- While an Apply/Load/Adjust operation is running against the hardware, the toolbar is disabled to prevent a second overlapping operation.
- The function tabs are described below. Most values are entered in microseconds (shown as
[us]in the column heading); the hardware quantizes them to its internal sample units, so the read-back value after an Apply may differ slightly from what you typed.
AnalogSignal
- Controls the analog conditioning applied before digitization, per channel:
- Offset [V] – the DC offset applied to the analog signal.
- Gain (combo box) – amplification. High gain = x4, low gain = x1. (Stored in CSRA bit 14; see the note below.)
- Polarity (combo box) – polarity of the input signal (+ or -). Negative polarity signals are inverted on the QtScope canvas display. (Stored in CSRA bit 5.)
- The [Adjust offsets] button runs the modules' automatic DC-offset calibration, which sets each channel's baseline to approximately the target percentage of the ADC range (default ~10%, i.e. ~6500 counts on a 16-bit ADC; the target is set on the Baseline tab).
- Note
- Gain and Polarity are CSRA register bits, but they are set on the analog signal tab because they describe the analog input. They appear (greyed out) on the CSRA tab for reference but can only be changed here.
TriggerFilter
- Defines the fast (trigger) filter – the trapezoidal filter used to detect hits:
- TriggerRise [us] – filter risetime (the risetime of the leading and trailing edges of the trapezoidal filter; called "length" in the Pixie-16 manual).
- TriggerGap [us] – filter flat-top / gap.
- Threshold [arb.] – leading-edge threshold. The fast filter output crossing the threshold value is what generates a trigger.
- If the CFD is disabled, the trigger time is the leading-edge crossing time. If the CFD is enabled and does not find a valid zero-crossing, the trigger time falls back to the leading edge time.
EnergyFilter
- Defines the slow (energy) filter – the trapezoidal filter used to measure pulse energy:
- EnergyRise [us] – integration time / risetime.
- EnergyGap [us] – flat-top / gap. Should be larger than the largest expected risetime of your input signal.
- Filter range – a multiplier that lets you use longer effective filters by averaging ADC samples ahead of the energy-filter logic. This is actually a module-level setting: changing it affects all channels on the module, and QtScope warns you that filter parameters may change as a result.
- The energy filter follows the double-exponential algorithm of Tan et al., IEEE Trans. Nucl. Sci. 51 (2004) 1541.
CFD
- Configures the digital constant-fraction discriminator for sub-sample hit timing (only used if the CFD bit is enabled on the CSRA tab):
- Delay [us] – the delay applied to the fast-filter signal before it is subtracted from itself.
- Scale – the fraction subtracted, specifically \(1-s/8\) for scale \(s\in\{0,\ldots,7\}\).
- Threshold [arb.] – a CFD threshold that suppresses noise-triggered zero-crossings.
- Attention
- On 500-MSPS modules the Delay and Scale are fixed by the hardware implementation; only the Threshold is user-adjustable, and QtScope disables the other two fields automatically.
Tau
- Tau [us] – the exponential decay constant of the detector pulse tail. The energy filter uses this to correct for the pulse decay; set it to the true decay time of your signal.
Trace
- Controls on-board waveform (trace) capture:
- TraceLength [us] – total captured trace length.
- TraceDelay [us] – pre-trigger baseline length.
- [ ] Record traces – enables trace output for every channel on the module (CSRA bit 8).
- Attention
- Enabling trace output adds words to each event. The corresponding module event length in
modevtlen.txtmust account for this or DDAS Readout will fail. The same applies to QDC and energy sums.
CSRA
- The Control Status Register A is a per-channel 32-bit register controlling many features. Each configurable bit is a column of check boxes; hover a column heading for a tooltip. The [Set all] buttons enable/disable a bit for all channels at once. Some bits (Gain, Polarity, Trace enable) are set on other tabs and appear here greyed out. A bit is "enabled" (1) when its box is checked. The value of the CSRA register as a 32-bit unsigned integer is shown next to the channel index in the Value column. This value is not configurable, the CSRA must be set using the toggleable bits.
| Bit | Column | Meaning (enabled / disabled) |
|---|---|---|
| 0 | FTrS | Fast trigger from system FPGA / local fast trigger |
| 1 | ETrS | Module validation trigger from front-panel LVDS / from system FPGA |
| 2 | Good | Enable / disable this channel's trigger validation and data recording. Disabled channels still generate fast triggers (usable in coincidence) but produce no recorded data. |
| 3 | CTrS | Channel validation trigger from front-panel LVDS / from system FPGA |
| 4 | Sync | Halt acquisition if any trace/header buffer on the module is full / only if this channel's is full |
| 5 | SPol | Invert input signal / do not (set on AnalogSignal) |
| 6 | Veto | Enable / disable channel veto (works with bits 19/20) |
| 7 | HistE | Unused – current firmware always histograms energy |
| 8 | Trce | Write / do not write trace data (set on Trace tab; affects event length) |
| 9 | QDC | Write / do not write QDC sums (affects event length) |
| 10 | CFD | Enable / disable the digital CFD |
| 11 | MTrV | Require / do not require coincidence with the module validation trigger |
| 12 | ES | Write / do not write energy sums (affects event length) |
| 13 | CTrV | Require / do not require coincidence with the channel validation (multiplicity) trigger |
| 14 | HiG | High gain x4 / low gain x1 (set on AnalogSignal) |
| 15/16 | PC1/PC2 | Pileup control: 00 record all; 01 reject pileup; 10 header-only for pileup; 11 pileup-only |
| 17 | ECut | Not implemented |
| 18 | GTrs | Not implemented |
| 19 | CVtS | Channel veto from system FPGA / front-panel LVDS (with bit 6) |
| 20 | MVtS | Module veto from system FPGA / front-panel LVDS (with bit 6) |
| 21 | EnTS | Record / do not record external-clock 48-bit timestamp (affects event length) |
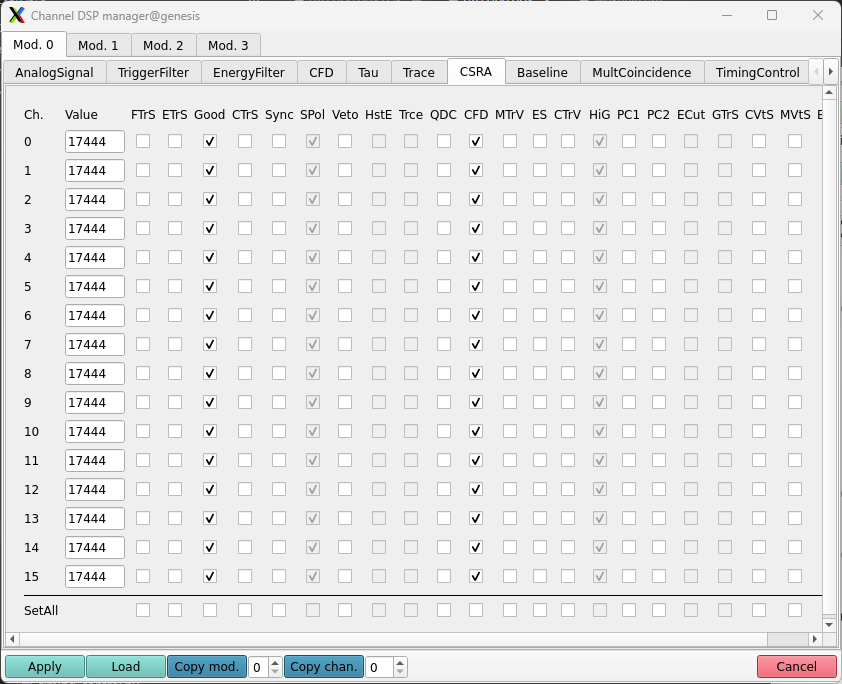
The CSRA tab with each configurable bit represented by a checkbox. Greyed-out settings like the polarity and whether traces are enabled are set on other tabs. The Value = 17444 is the integer representation of the CSRA register for each channel.
Baseline
- Baseline % – target baseline as a percentage of full ADC range, used by the automatic baseline adjustment routine.
- BaselineCut – measured baselines differing from the running average by more than this are rejected (not averaged in).
- It is generally recommended to leave both at their default values.
MultCoincidence
- Configures channel groupings and coincidence for on-module multiplicity logic:
- Channel grouping – groups the module's channels for coincidence. On a 16-channel module the supported groupings are things like 8x2 (eight pairs: (0,1), (2,3), ...), 5x3, 4x4, 2x8, 1x16, etc. (5x3 groups 15 of 16 channels; the 16th triggers freely.) If the stored coincidence masks don't match a known grouping, the control shows **"Unknown"** – often a sign of a corrupted settings file.
- Channel coincidence width [us] – the coincidence window for the grouping (the same parameter is shown, disabled, as "ChanCoincWidth" on the TimingControl tab).
- Minimum multiplicity to trigger – the minimum number of fast triggers required within a group to validate.
- Channel validation status – shows Enabled (green) if the trigger-validation CSRA bit is set for all channels, Disabled (red) if none, or Custom (yellow) if only some channels are validated.
- Note
- On 32-channel modules the predefined 16-channel groupings do not apply, so this tab reports that the feature is unsupported and disables its controls. (Correct 32-channel groupings require input from the XIA; the disable is an intentional safeguard against silently writing a wrong coincidence configuration.)
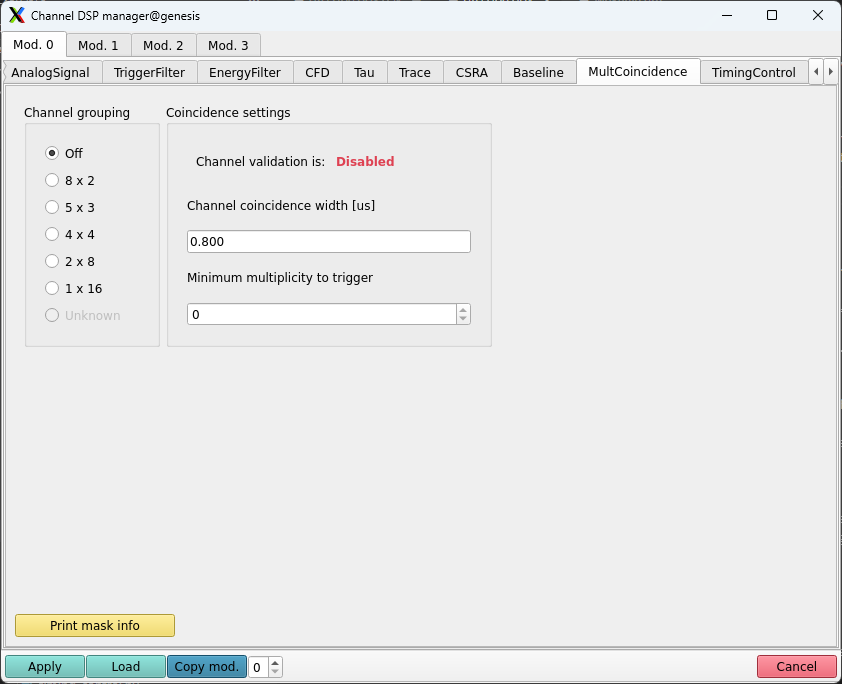
The Multipliplicity and Coincidence tab. The [Print mask] button will print the values of the 32-bit multiplicity masks for each channel on the module.
TimingControl
- Sets the relative timing between module fast triggers and the validation signal. Click [Show timing diagram] for a labeled picture (the nominal fast-trigger point is
t = 0). The fields:- FastTrigDelay [us] – Delay of the (external) fast trigger.
- ORDelay [us] – Delay of the trigger OR output.
- ORWidth [us] – Width of the fast-trigger back/OR.
- ChanCoincWidth [us] – Channel-coincidence window (display only here – set on MultCoincidence).
- ExtTrigWidth [us] – External validation-trigger width.
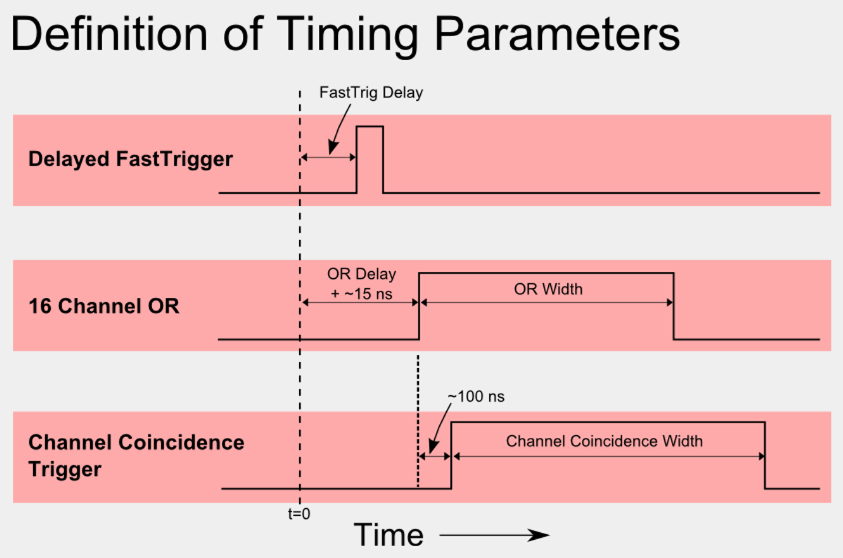
Schematic of the timing settings displayed when the [Show timing diagram] button is clicked.
- A full description of the Pixie-16 multiplicity/coincidence trigger scheme is beyond this tutorial; see the Pixie-16 User Manual, Sec. 3.3.11 and Appendix A.
Histogram
- Controls the on-board MCA energy histogram, per channel:
- EMin – the minimum energy recorded in the on-board histogram (a lower cutoff). Integer, 0-65535.
- BinFactor – the histogram binning/compression factor. Integer, 1-16.
- Both values are entered and displayed as integers.
QDCLen
- Defines the eight QDC integration windows used when QDC sums are enabled (CSRA bit 9). Each channel has eight consecutive integration-window lengths:
- QDCLen0 [us] ... QDCLen7 [us] – the lengths of the eight QDC sum windows.
- These sums are only recorded when the QDC bit is enabled, and (like traces), enabling them changes the event length in
modevtlen.txt. Consult the Pixie-16 manual for the exact meaning of each window.
Module DSP Settings
- Click [Module DSP] to open the module configuration window. Module DSP parameters apply to a whole module. This window shares the same [Apply] / [Load] / [Cancel] toolbar behavior as the Channel DSP window (the Copy buttons are hidden here). [Apply] writes to all modules; [Load] reads them back.
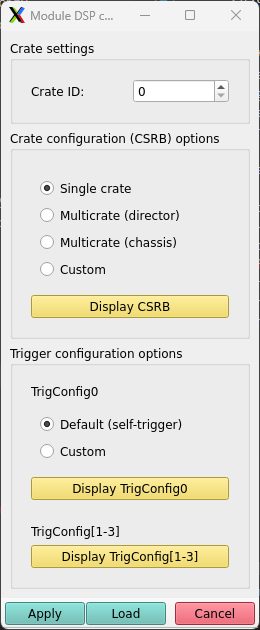
The QtScope module DSP configuration popup.
Crate Settings (Crate ID)
- A spin box sets the crate ID applied to all modules at once. The value is written when you click [Apply].
Crate Configuration (CSRB)
- Automatically configures the Module Control Status Register B by choosing a predefined crate role:
- Single crate – standalone crate (the most common case).
- Multicrate (director) – the director crate supplying the master clock; only one per multi-crate system.
- Multicrate (chassis) – a crate that receives its clock from the director.
- Custom – hand-configure the CSRB bits (rarely needed).
- Click [Display CSRB] to open a grid of the CSRB bits (one row per module, with tooltips on the column headings). To edit bits directly, choose Custom first.
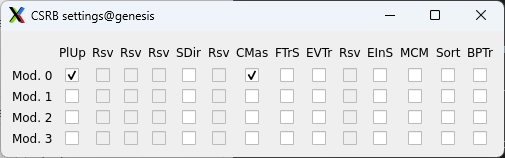
Module CSRB settings displayed when the [Display CSRB] button is clicked. Settings can only be directly configured if the Custom button is selected.
Trigger Configuration (TrigConfig0)
- Configures the TrigConfig0 register:
- Default – every channel self-triggers (the usual setup).
- Custom – full manual control of the TrigConfig0 register.
- Click [Display TrigConfig0] to open the per-module grid (tooltips explain each field; editable only in Custom mode). The most common custom configurations at the lab are enabling the front-panel LVDS digital output or configuring e.g., an external module validation trigger.

TrigConfig0 register settings displayed after the [Display TrigConfig0] button is clicked. Each dropdown menu sets bits in the TrigConfig0 register for the selected module. For more information about the various options on this menu, refer to the Pixie-16 manual.
TrigConfigExtra
- Provides read-only access to the additional trigger-configuration registers TrigConfig1, TrigConfig2, and TrigConfig3. Click [Display TrigConfig[1-3]] to open a grid with one row per module and one column per register; each cell displays a full unsigned 32-bit value. These registers are non-zero usually in the case of custom firmware e.g., that used by the FDSi collaboration. Most users do not need to worry about these settings.
Exiting QtScope
- Exit in any of these equivalent, safe ways:
- Click [Exit] on the system toolbar.
- Click the window [X].
- Press Ctrl-C in the launching terminal.
- All three run the same clean shutdown: any active run is ended, the modules are released , the QtScop internal the thread pool is drained, native resources are freed, and the application quits. A brief pause during shutdown is normal – QtScope is talking to the hardware synchronously so shutdown cannot race an in-flight operation.
Reference: Parameter Names
- For folks who need to correlate GUI controls with the underlying XIA parameter names (e.g. when reading a JSON settings file).
Channel Parameters
| GUI location | GUI label | XIA name |
|---|---|---|
| TriggerFilter | TriggerRise [us] | TRIGGER_RISETIME |
| TriggerFilter | TriggerGap [us] | TRIGGER_FLATTOP |
| TriggerFilter | Threshold [arb.] | TRIGGER_THRESHOLD |
| EnergyFilter | EnergyRise [us] | ENERGY_RISETIME |
| EnergyFilter | EnergyGap [us] | ENERGY_FLATTOP |
| Tau | Tau [us] | TAU |
| Trace | TraceLength [us] | TRACE_LENGTH |
| Trace | TraceDelay [us] | TRACE_DELAY |
| AnalogSignal | Offset [V] | VOFFSET |
| (trace sampling interval) | – | XDT |
| Baseline | Baseline % | BASELINE_PERCENT |
| CSRA | (register) | CHANNEL_CSRA |
| Baseline | BaselineCut | BLCUT |
| TimingControl | ORWidth [us] | FASTTRIGBACKLEN |
| CFD | Delay [us] | CFDDelay |
| CFD | Scale | CFDScale |
| CFD | Threshold [arb.] | CFDThresh |
| QDCLen | QDCLen0...7 [us] | QDCLen0...QDCLen7 |
| TimingControl | ExtTrigWidth [us] | ExtTrigStretch |
| MultCoincidence | (low mask) | MultiplicityMaskL |
| MultCoincidence | (high mask / min mult.) | MultiplicityMaskH |
| TimingControl | FastTrigDelay [us] | ExternDelayLen |
| TimingControl | ORDelay [us] | FtrigoutDelay |
| TimingControl / MultCoincidence | ChanCoincWidth [us] | ChanTrigStretch |
| Histogram | BinFactor | BINFACTOR |
| Histogram | EMin | EMIN |
Module Parameters
| GUI location | XIA name |
|---|---|
| Mod DSP -> Crate settings -> Crate ID | CrateID |
| Mod DSP -> Crate configuration (CSRB) | MODULE_CSRB |
| Mod DSP -> TrigConfig0 | TrigConfig0 |
| Mod DSP -> TrigConfigExtra | TrigConfig1, TrigConfig2, TrigConfig3 |
| Chan DSP -> EnergyFilter -> Filter range | SLOW_FILTER_RANGE |