QtScope Manual
Table of Contents
- Date
- 7/17/23
Introduction
- The QtScope program provides a slow-control graphical-user interface (GUI) used to configure digital signal processing (DSP) parameters for DDAS systems (often used interchangably with digial pulse processing or DPP parameters). Available starting with the release of NSCLDAQ 12.0, QtScope is a full replacement for the nscope program, which will no longer be actively supported and maintained.
- QtScope was written using a set of Python bindings for Qt5 called PyQt5 and takes advantage of both the GUI design capabilities of Qt as well as familiar Python tools matplotlib and the NumPy package for scientific computing. Communication with the Pixie-16 modules via the XIA API is implemented using the Python ctypes foreign function library. QtScope implements a model-view-controller (MVC) architecture for user interaction with the Pixie-16 hardware and manages the DSP parameters internally using a Python dataframe.
- In this guide we will cover:
- The feature set of QtScope.
- How to get started using QtScope to configure DSP parameters.
- How to use QtScope to inspect data acquired with the parameters you configure.
QtScope Feature Set
- QtScope provides a number of useful features for configuring DDAS systems, including:
- Configuration of multiple modules in a single crate.
- Control over all parameters for the energy and trigger filters.
- Control over the CSRA and CSRB registers and the ability to configure individual register bits.
- Limited control over the coincidence settings of the modules in the crate.
- Automatic baseline calculations.
- Histogram acquisition for a single module at a time.
- Trace and trapezoidal filter visualization.
- Reading and writing firmware settings files.
- QtScope is the lab-supported software for configuring DDAS systems, replacing the nscope program many users are familiar with. In addition to the features provided by nscope, QtScope offers some of improvements:
- Utilizes the Python/C API to extend the Python interpreter with modules written in C/C++ to interact with the Pixie-16 hardware.
- Adoption of common Python libraries for numerical methods.
- A flexible and extensible GUI written in PyQt5.
- Improved UI blocking.
- Unified interfaces for configuring channel-level and module-level DSP parameters.
- Pre-defined crate configurations for common single- and multi-crate setups.
- Event logging for debugging/troubleshooting, described in more detail below.
Event Logging
- An important new feature of QtScope which was not implemented in the nscope program is event logging, which is described in more detail here. Information about the program execution, warnings and errors are written to a file called qtscope.log (the "logfile") in the runtime location of the program. What exactly gets written to the logfile is determined by a "logging level," which defines the minimum severity event written to the logfile. Users have control over the logging level via the environment variable
QTSCOPE_LOG_LEVEL. Allowed levels are, in increasing order of severity:debug,info,warning,errorandcritical. IfQTSCOPE_LOG_LEVELis not set, the logging level defaults toinfo. In order to overwrite the default logging level, set the value ofQTSCOPE_LOG_LEVELto your desired value, for example:export QTSCOPE_LOG_LEVEL=debug
sets the logging level to write debugging information (and all elevated severity levels!) to the logfile. The logging level is configured on QtScope startup.
Getting Started
- The very first thing that a user needs to do to run QtScope is to connect a PXI crate with at least one Pixie-16 card to a host PC. The PXI crate must be powered on.
- Attention
- If you have not set up a DDAS system before, it is probably best to stop reading this and work your way through a set up tutorial (e.g. Single-crate system setup guide).
- To run QtScope, the NSCLDAQ environment must be configured by sourcing its daqsetup.bash script:
. /usr/opt/daq/12.0-015/daqsetup.bash
for QtScope from NSCLDAQ version 12.1-015. Sourcing this script will set theDAQBINenvironment variable to point to the directory where theqtscopeexecutable is installed for the selected version of NSCLDAQ. Once complete, the QtScope executable can be launched with the following command:$DAQBIN/qtscope
Note that QtScope expects to be run on a machine connected to Pixie-16 hardware–at FRIB this is typically an spdaq computer–and from a directory containing the necessary cfgPixie16.txt and modevtlen.txt configuration files. Running theqtscopeexecutable launches the QtScope GUI. The various elements of the GUI are labeled on the figure below.
The QtScope GUI state on startup with labeled GUI elements. Note that most GUI elements besides [Boot system], [About] and [Exit] on the system toolbar are disabled.
- Upon startup, the majority of the GUI elements besides [Boot system] and [Exit] on the system toolbar are disabled. This is because no firmware or DSP parameters have been loaded onto the modules. The process of programming the module firmware and DSP settings onto a module is colloquially called "booting." Clicking the [Boot system] button on the left side of the system toolbar will attempt to boot the Pixie-16 modules using the configuration files present in the runtime directory. During the boot process, firmware is loaded and the parameter configuration file is written to the modules in the crate. Summary output is written to the terminal during this process:
------------------------
Initializing PXI access...
System initialized successfully.
Found Pixie-16 module #0, Rev=15, S/N=1150, Bits=16, MSPS=250

Booting Pixie-16 module #0
        ComFPGAConfigFile:  /usr/opt/ddas/firmware/2.2-000/firmware/syspixie16_current_16b250m.bin
        SPFPGAConfigFile:   /usr/opt/ddas/firmware/2.2-000/firmware/fippixie16_current_16b250m.bin
        DSPCodeFile:        /usr/opt/ddas/firmware/2.2-000/dsp/Pixie16_current_16b250m.ldr
        DSPVarFile:         /usr/opt/ddas/firmware/2.2-000/dsp/Pixie16_current_16b250m.var
        DSPParFile:         /user/0400x/ddas_xiatest/readout/crate_1/crate_1.set
--------------------------------------------------------

Start to boot Communication FPGA in module 0
Start to boot signal processing FPGA in module 0
Start to boot DSP in module 0
The information written to the terminal should match the information provided in the cfgPixie16.txt file. Any errors encountered during the boot process will be written to the terminal and to the logfile. The error messages are invaluable for troubleshooting a non-working system and can be used to identify and fix issues which cause a failed boot. If all the modules in the system boot correctly, the following message is displayed:All modules ok QtScope system configuration complete!
and the [Boot system] button will turn green and read [Booted]. GUI elements on the various toolbars will also be enabled; these GUI elements are explained in more detail in the subsequent sections.
The QtScope GUI state after a successful system boot. Note that the button previously displaying [Boot system] is now green and reads [Booted]. The GUI elements are enabled upon a successful boot.
The QtScope GUI
- In this section the GUI elements of QtScope are described in detail.
The System Toolbar

The QtScope system toolbar.
- The system toolbar is used to manage the state of the system. The buttons on this toolbar allow the user to:
- Boot modules,
- Configure channel- and module-level DSP parameters,
- Save and load DSP settings files,
- View information about the QtScope program,
- Cleanly exit the program, releasing resources from the modules.
The Boot System Button
- Upon startup the first thing a user should do is click the [Boot system] button to load firmware and DSP parameters onto the modules. Upon successful boot, the [Boot system] button will turn green and change its displayed text to "Booted." Clicking this button will have no effect if the system has already been booted.
The Channel DSP Button
- Clicking the [Channel DSP] button will open a popup window which allows you to configure channel DSP parameters for the entire system. Channel DSP parameters are applied on a single channel on a module, for example the fast filter parameters used to trigger the channel. The channel DSP parameters are organized using a series of nested tabs. There is a top-level tab for each installed module in the system. DSP parameters for a single module are organized by function into a set of tabs under the module tab.
- Note
- QtScope refers to modules using an internal zero-indexed counter. The module number displayed in QtScope should not be confused with the module's slot number in the PXI crate. If there are modules installed in slots 2 and 4, the module installed in slot 2 is module 0 and the module in slot 4 is module 1 in the QtScope GUI.
- Selecting a tab will display that tab's DSP parameters. The DSP parameters which can be configured on each tab are described in more detail in the Configuring Channel DSP Settings section.

The channel DSP popup window displayed when clicking the [Channel DSP] button. The tab controlling the analog signal properties and DC offset on module 0 is selected. If more modules were installed, additional tabs reading ''Mod. 1,'' ''Mod. 2,'' etc. would be present.
- A common feature of all channel DSP parameter tabs are the [Apply], [Load], [Copy mod.] and [Copy chan.] buttons. The [Apply] button will write the channel parameters displayed on the GUI to every channel on the corresponding module. Clicking [Load] will load the currently displayed channel DSP parameters from the module and display them on the GUI. To copy all displayed DSP parameters from another module in the system to the currently displayed module, select a module number to copy from using the spin box next to the [Copy mod.] button, then click [Copy mod.]. Similarly, to copy DSP parameters from a single channel on the currently displayed DSP parameter tab to all channels on the module, select a channel using the spin box next to the [Copy chan.] button, then click [Copy chan.]. The [Cancel] button will close the channel DSP popup window.
- Attention
- The copy buttons modify data in the underlying Python dataframe used internally by QtScope to manage the DSP parameters. In order to write the parameters to the module, you must click [Apply] after copying.
The Module DSP Button
- Clicking [Module DSP] will open a popup window which allows you to configure module DSP parameters. Module DSP parameters are applied at the module level, for example the crate ID value specifying where these modules are installed. The module DSP window allows the user to automatically configure the crate and trigger settings for common setups. The DSP parameters configurable in this window are discussed further in Configuring Module DSP Settings.
- Similar to the channel DSP parameters, the [Apply] and [Load] buttons will write and read parameters from the modules based on what is set on this window, respectively. The [Cancel] button will close the popup.
The module DSP popup window displayed when clicking the [Module DSP] button.
The Load and Save Settings Buttons
- The [Load settings] and [Save settings] buttons allow the user to load a new set of DSP parameters onto the modules and to save DSP parameters to a settings file. Clicking either button will open a file dialog. The file dialog windows are similar for loading and saving module, the save dialog window is shown below. For both the file name can be entered on the ''File name:'' line or an existing file can be selected by using the browser. Existing DSP settings files with the same name will be overwritten.
The QtScope save dialog window opened when the [Save settings] button is clicked. The [Load settings] button will popup a dialog window which looks and functions similarly.
- The format of the DSP settings file depends on the version of the XIA API that QtScope and NSCLDAQ were compiled with. For XIA API version 2, the DSP settings file is a binary file and is not human-readable, while in XIA API version 3+, the DSP settings file is JSON format and is human-readable. One thing to note is that the DSP parameter values in a JSON-formatted settings file are given in the units used internally by the modules, e.g. the fast filter risetime is given in units of ADC samples rather than microseconds.
The About Button
- Clicking the [About] button will bring up some information about the version of QtScope you are currently using. As part of the open-source licensing requirement for Qt, links with instructions for building Qt from source and the source code of the QtScope project are provided.
The Exit Button
- The [Exit] button exits the QtScope program and frees resources used by the module. Clicking the [X] in the upper right of the main GUI window has the same effect. This is the safest way to exit the program (as opposed to, say, Ctrl-C).
The Acquisition Toolbar

The QtScope acquisition toolbar.
- The acquisition toolbar allows you to inspect data acquired using the DSP settings programmed with QtScope. Using the acquisition toolbar you can:
- Select the module and channel(s) to read data from,
- Acquire and display ADC traces,
- Display simulated timing and energy filter outputs,
- Acquire and display energy histogram and baseline data.
The Channel Selection Box
- The "Channel selection" box allows the user to specify which module and channel in the crate to read data from. Modules are numbered sequentially starting from 0. If the [ ] Read all button is checked, data from all modules will be read and displayed on the canvas. Note that acquiring and rendering data from all channels on the canvas may take longer than for a single-channel acquisition. Be patient.
The Trace Acquisition Box
- The "Trace acquisition" box buttons allow a user to view ADC trace data on the canvas. When the [Read trace] button is clicked, QtScope will attempt to acquire an ADC trace from the channel specified in the "Channel selection" box (or for each channel on the module, if the [ ] Read all button is checked). The program will search for what it thinks is a good pulse (a "validated" signal), or reaches a reacquire limit. In the case that no validated trace is found during this process, the last acquired trace will be shown. If the [ ] Fast acquire button is checked, QtScope will display ADC traces without the validation requirement. Acquired traces are 8192 60-ns samples long. The 60-ns sampling time is a limitation of the XIA API used to acquire traces for display and cannot be modified by the user. This limitation is not present when trace data is written to disk. The QtScope GUI displaying an acquired trace is shown below.
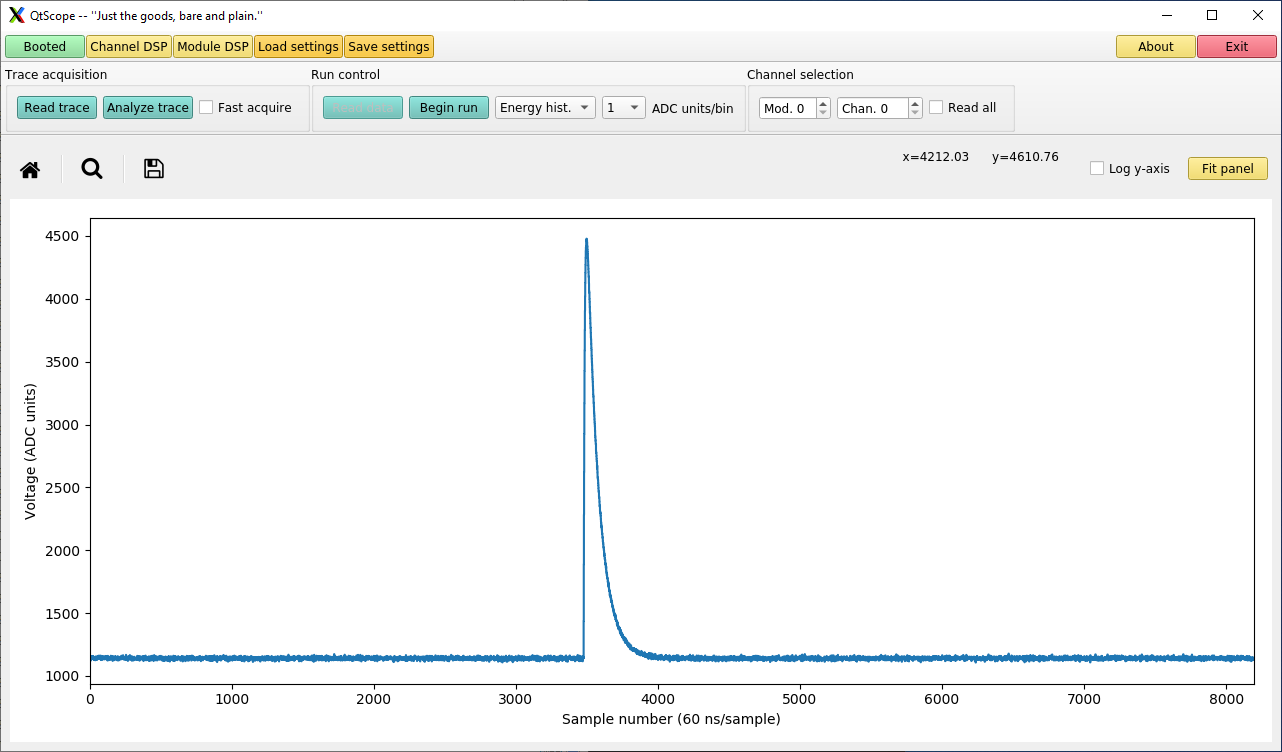
QtScope displaying an acquired trace from Mod. 0, Chan. 0 using the [Read trace] button.
- Simulated filter outputs for an acquired trace displayed on the canvas can be viewed by clicking the [Analyze trace] button. Clicking this button will divide the canvas into three sub-canvases, displaying, from top to bottom, the trace, the timing filter and CFD output, and the energy filter output. These outputs can be used to guide the choice of DSP parameters. If no trace is displayed on the canvas and the [Analyze trace] button is clicked, QtScope will attempt to acquire a trace to analyze.
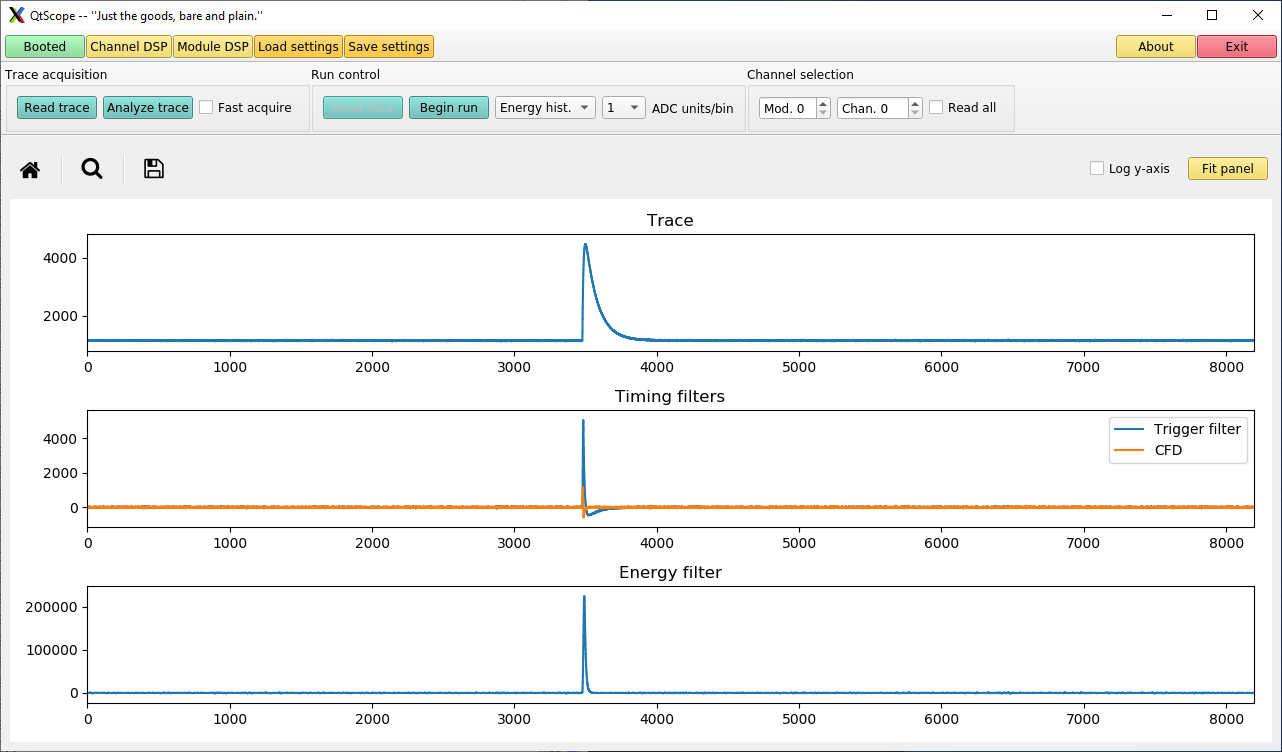
QtScope displaying a trace and its simulated filter outputs from Mod. 0, Chan. 0 after clicking the [Analyze trace] button.
The Run Control Box
- The "Run control" group box widgets allow the user to begin and end energy histogram or baseline data runs, read data from the module while the run is active and set the histogram binning. The run type is controlled by the first of the two combo boxes in the group box and is by default configured to display channel energy histograms ("Energy hist."). Clicking on the combo box allows you to select a different run type. The next combo box controls the histogram binning in ADC units per bin. By default, this is set to 1 ADC unit/bin. Selecting another value from the binning combo box will rebin all run histograms currently displayed on the screen. A copy of the underlying data used to construct the histograms is maintained by QtScope, so the binning can be adjusted freely.
- Clicking [Begin run] will begin a data run in the selected module. The toolbar state will change to reflect the run active status. The [Begin run] button will switch to read [End run] and the [Read data] button will be enabled. Something like the message
Beginning histogram run in Mod. 0
will be displayed on the terminal. Additionally, QtScope features that cannot be used while a run is active will be disabled. Clicking on a disabled feature will have no effect while the run is active.

The acquisition toolbar state while a run is active. Some GUI elements are disabled while a run is active, for example, the buttons to read and analyze ADC traces.
- To read run data and display a histogram on the canvas, click the [Read data] button. The canvas will be updated with the acquired data as shown below.
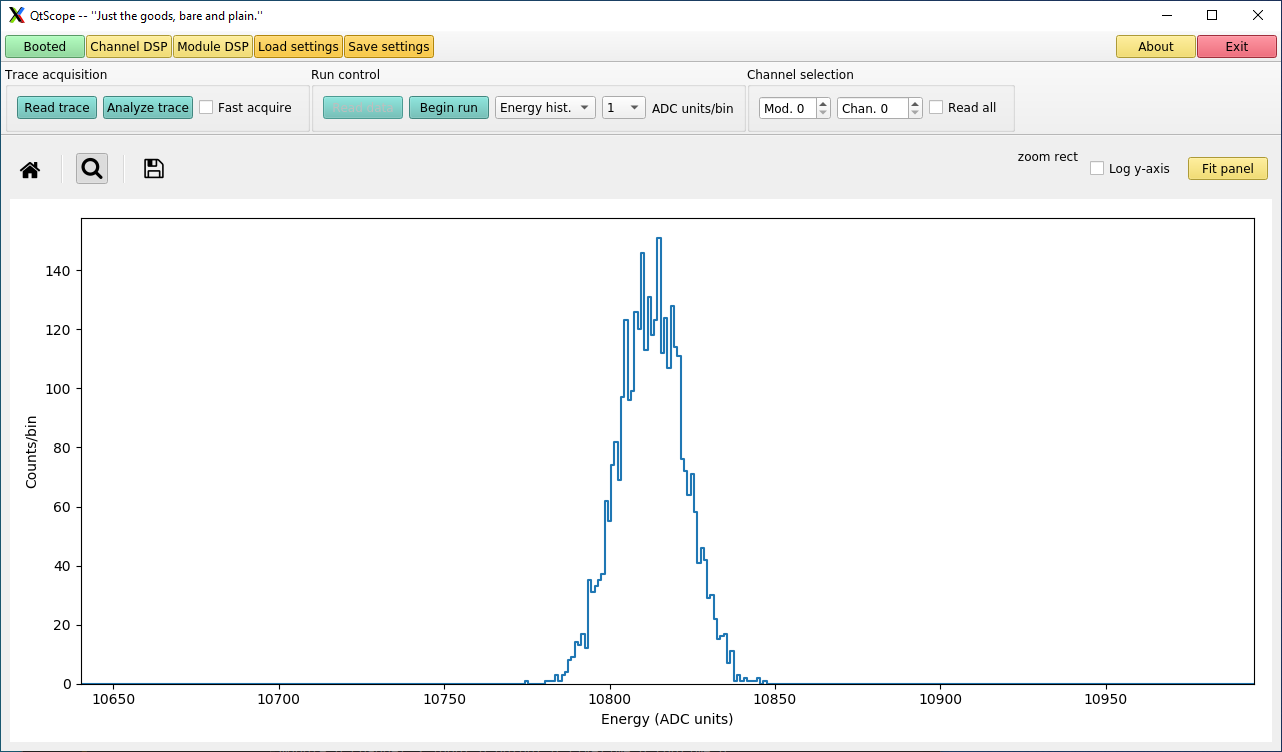
Energy histogram for a pulser signal connected to a Pixie-16 module. The spectrum was displayed on the canvas using the [Read data] button. Only the region of interest containing the peak is shown.
- When the [End run] button is clicked, the run will end and QtScope will return to its run inactive state. An end run message similar to
Ended histogram run in Mod. 0
will be printed to the terminal. Run statistics will be printed to the terminal display for energy histogram runs. The statistics output will look similar to the following:Module 0 channel 0 input 534.613 output 534.613 livetime 11.932 runtime 11.932 Module 0 channel 1 input 0 output 0 livetime 11.932 runtime 11.932 Module 0 channel 2 input 0 output 0 livetime 11.932 runtime 11.932 Module 0 channel 3 input 0 output 0 livetime 11.932 runtime 11.932 Module 0 channel 4 input 0 output 0 livetime 11.932 runtime 11.932 Module 0 channel 5 input 0 output 0 livetime 11.932 runtime 11.932 Module 0 channel 6 input 0 output 0 livetime 11.932 runtime 11.932 Module 0 channel 7 input 0 output 0 livetime 11.932 runtime 11.932 Module 0 channel 8 input 0 output 0 livetime 11.932 runtime 11.932 Module 0 channel 9 input 0 output 0 livetime 11.932 runtime 11.932 Module 0 channel 10 input 0 output 0 livetime 11.932 runtime 11.932 Module 0 channel 11 input 0 output 0 livetime 11.932 runtime 11.932 Module 0 channel 12 input 0 output 0 livetime 11.932 runtime 11.932 Module 0 channel 13 input 0 output 0 livetime 11.932 runtime 11.932 Module 0 channel 14 input 0 output 0 livetime 11.932 runtime 11.932 Module 0 channel 15 input 534.613 output 534.613 livetime 11.932 runtime 11.932
For each channel, the number of triggers per second (input), the number of accepted triggers per second (output), the active time (livetime) and the total run time for the acquisition (runtime) are shown. In this case, you can see that a signal with a frequency of approximately 535 Hz was present in channels 0 and 15 on Module 0.
The Plot Toolbar

The QtScope plot toolbar.
- The plot toolbar allows the user to:
- Zoom in and out on the canvas,
- Save the canvas to a file (many different file formats are supported),
- Configure plots to display with linear or logarithmic y-axis scaling,
- Fit the displayed data using some basic fitting functions.
- To zoom in, select the magnifying glass and select a region of the canvas to magnify. The home button (the one that looks like a house) will reset the canvas to its default axis limits. Clicking the 3.5" floppy disk button will open a save dialog and allow you to save the canvas to one of many supported file types. Checking the [ ] Log y-axis box will redraw all plots on the canvas using logarithmic y-axis scaling.
- The "Fit panel" button opens a popup window which allows you to select a fitting function, define fit limits and set guesses for initial parameters. The [Fit] button at the bottom of the fit panel window will fit the displayed data using the fit limits and parameters–either supplied by the user or determined by QtScope from the data–and draw the selected function on the canvas using the best-fit parameters. Multiple fits will be superimposed on the canvas. To clear all the fit data and the best-fit parameter values displayed in the "Fit output" text box, click the [Clear] button. To close the fit panel window, click [Cancel]."
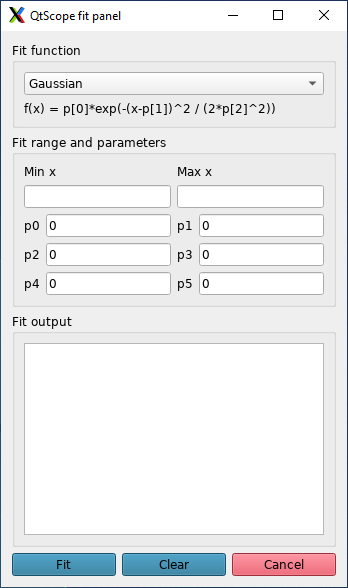
The QtScope fit panel.
- Implemented fitting functions can be selected using the combo box at the top of the panel. Displayed below the fitting function is its functional form. The fit limits are taken from the currently displayed axis limits if they are not provided by the user in the "Min x" and "Max x" boxes. The parameters p[0], p[1], etc. shown in the "Fit function" box correspond to the parameters p0, p1, etc. in the "Fit range and parameters" box. If initial parameters are not supplied by the user, QtScope will do its best to guess initial parameters from the displayed data.
(Left) A single-channel energy histogram fit with a Gaussian function. The zoom function of the plot toolbar was used to select a subset of the canvas containing the peak. (Right) The QtScope fit panel displaying fit results in the ''Fit output'' text box. The fit limits and initial parameters were determined by QtScope using the displayed data.
- The above figures shows the best-fit Gaussian curve to the displayed data on the QtScope canvas as well as the best-fit parameter values
Configuring Channel DSP Settings
- Each module tab contains a full set of configurable channel DSP parameters which can be written to and read from the Pixie-16 modules. Changes made to these parameters will produce visible changes to the way the device triggers and computes energy and timing information for a given signal. The tabs present on the channel parameter GUI are described in more detail in this section.
The Analog Signal Tab
- Signals that are input to the Pixie-16 digitizers are first processed as analog signals prior to digitization. There are three parameters per channel that can be set to control the analog conditioning which are set on this tab. The Pixie-16 digitizers apply a DC offset to the analog signal, amplification, and a possible inversion of the signal.
The AnalogSignal tab.
- The tab provides control over all three the aspects of the analog conditioning circuit. The parameter in the column labeled "Offset [V]" will control the DC offset (in volts), the "Gain" column will control the amplification and the polarity is controlled by the "Polarity" column. Single-channel analog signal properties are displayed on each row, with the zero-indexed channel number shown on the left. Automatic adjustment of the DC offset can be performed by clicking the [Adjust offsets] button. This will allow the Pixie-16 software to calibrate the channel DC offsets such that the signal baseline lies at approximately 10% of the maximum ADC range (by default; see the Baseline tab), i.e. approximately 6500 for a 16-bit ADC.
- Note
- The "Gain" and "Polarity" settings are set via bits in the channel CSRA register, but are configurable on this tab because they describe the properties of the input analog signal. The values of these settings are visible on the CSRA tab, but are configurable only on the this tab.
The Trigger Filter Tab
- This tab provides control over the risetime "TriggerRise [us]" and gap "TriggerGap [us]" which define the trapezoidal filter used to generate the channel fast trigger. Both the risetime and gap are displayed in units of microseconds, which is displayed on the QtScope GUI as "[us]." The rightmost column "Threshold [arb.]" defines the threshold setting for the channel. The threshold is used with the trigger filter output to implement a leading-edge discriminator. Once the output of the trigger filter exceeds the threshold, a fast trigger is generated.
- Attention
- For more information about the implementation of digital filters on the Pixie-16 modules, please refer to the Pixie-16 User's Manual. Note that the filter risetime is referred to as a filter "length" in the User's Manual.
The TriggerFilter tab.
- If the CFD triggering is disabled (see the CSRA tab), the trigger time is given by the leading-edge time. Alternatively, if the CFD is enabled then the rise and gap times are used in conjunction with the CFD scale and delay factors to implement a digital CFD algorithm to generate a trigger time. If the CFD output fails to exceed the CFD threshold, or no valid CFD zero-crossing point can be determined, the trigger filter will be used instead to generate a leading-edge fast trigger. Refer to the CFD tab for more information).
The Energy Filter Tab
- This tab provides control over the risetime (integration time) "EnergyRise [us]" and gap "EnergyGap [us]" which define the trapezoidal filter used to determine the energy of a signal pulse. The "Filter range" allows the user to set longer filter lengths by averaging ADC samples prior to the energy filtering logic in the FPGA. For details on the implementation of the energy filter, refer to - "A Fast Digital Algorithm for Gamma-Ray Spectroscopy With Double-Exponential Decaying Scintillators." H. Tan et al., IEEE Trans. Nucl. Sci. 51(4) (2004) 1541.
The EnergyFilter tab.
The CFD Tab
- The user can configure the device to use a digital CFD algorithm for determining channel hit timestamps. The CFD algorithm allows timestamps to be acquired with sub-sample resolution if the CFD bit is set on the CSRA tab.
The CFD tab.
- A detailed description of the Pixie-16 digital CFD algorithm and its corresponding parameters are given in the Pixie-16 User's Manual. The CFD is constructed by subtracting a delayed fast filter signal from itself. The "Delay [us]" parameter controls the length of this delay and the "Scale" parameter controls the fraction of the delayed signal to subtract (specifically \(1-s/8\) where \(s\in 0,1,\ldots,7\) is the scale factor). A CFD threshold, configured in the "Threshold [arb.]" column, is used to prevent noise-generated CFD zero-crossing points. If the CFD is not enabled on the CSRA tab, or if the CFD algorithm fails to find a valid zero-crossing point, channel timestamps will be determined using the leading-edge trigger generated using the trigger filter settings.
- Attention
- The values of the delay and scale parameters are fixed for 500-MSPS Pixie-16 modules due to the implementation of the digital CFD algorithm in those modules. For 500-MSPS modules, the user only has control over the threshold parameter.
The Tau Tab
- The digital filtering algorithm used by the Pixie-16 modules to measure input pulse energy accounts for the fact that signals from radiation detectors decay exponentially back to some baseline value. For exponentially decaying signals, the value of tau set on this tab should equal the decay constant of the exponential tail of the pulse in microseconds.
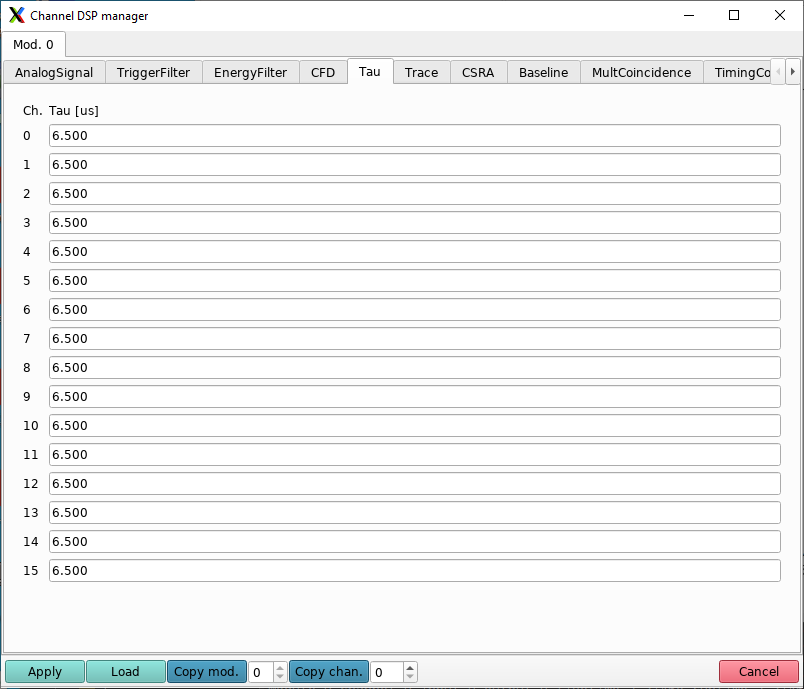
The Tau tab.
The Trace Tab
- Pixie-16 modules can be configured to output digitized waveform traces that were generated by the flash ADCs. To enable trace output, click the [ ] Record traces checkbox at the bottom of this tab. Note that clicking this button enables trace output for every channel on the module. The total length of the trace and the trace delay (length of the pre-trigger baseline) can be set on this tab. Both values are given in microseconds.
- Attention
- If the trace output is enabled, it is critical that the proper event length is set for the corresponding module in the modevtlen.txt configuration file. Improper event lengths will cause errors when running DDAS Readout programs.
- Note
- Enabling the trace output sets a bit in the channel CSRA register. The value of the trace enable bit is visible on the CSRA tab, but can only be set here.
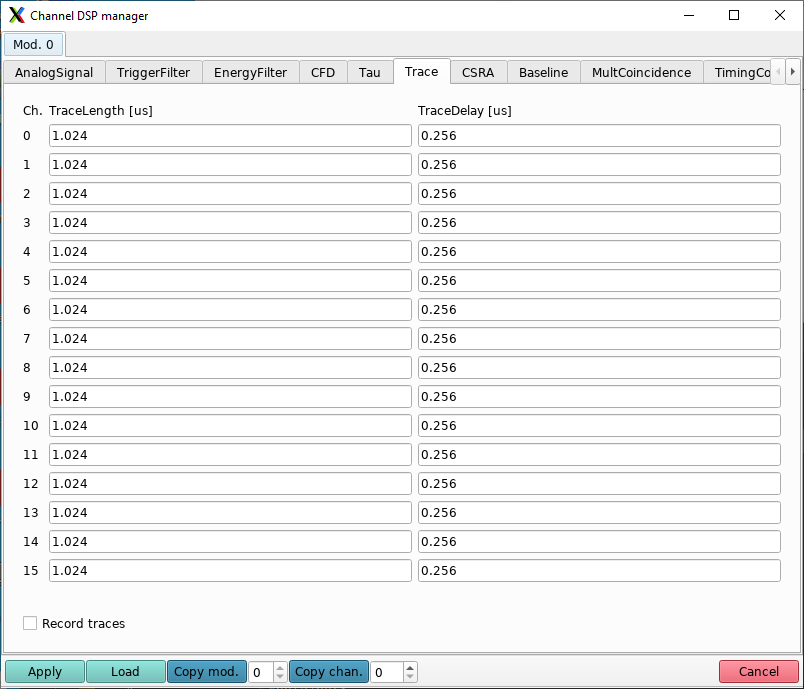
The Trace tab. Trace output is currently not enabled for this module because the **[ ] Record traces** button is not checked.
The CSRA Tab
- Many features and settings of the Pixie-16 modules are controlled using the "Control Status and Register A" or "CSRA" DSP parameter, such as whether or not the digital CFD algorithm is enabled. The CSRA parameter is 32-bit unsigned integer; user-controllable bits of the CSRA register correspond to the columns displayed on this tab. Hovering your mouse over the column headings will show a tooltip describing what the configurable bit in that column controls. The "Set all" buttons at the bottom of the tab will enable or disable the CSRA bit for all channels at once.
- Note
- Some CSRA settings must be set on another tab; for example the signal polarity and gain can be set only on the "AnalogSignal" tab. This is intended to prevent users from unintentionally changing previously set values. CSRA bits set on other tabs will display their status on this page, but the column will be grayed out.
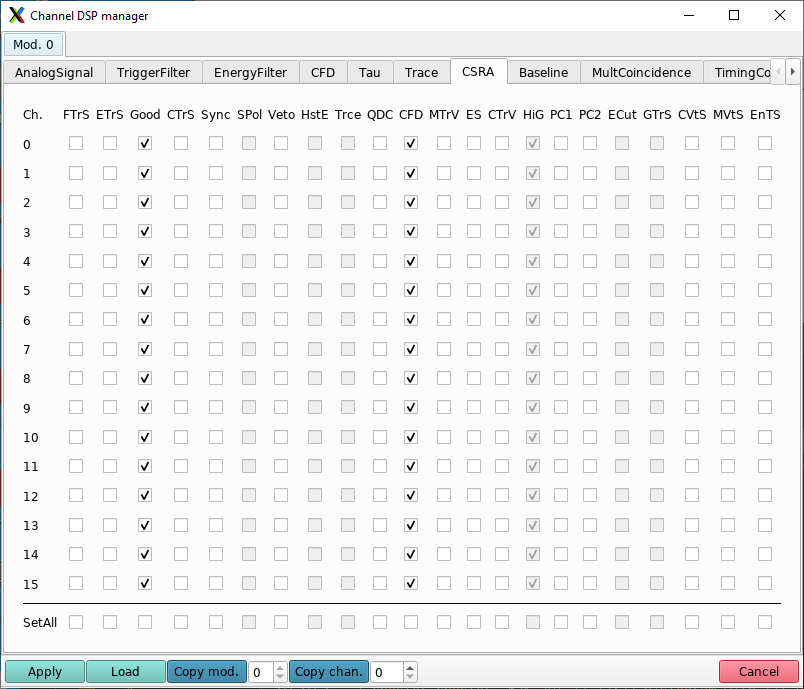
The CSRA tab. Note that bits in the ''HiG'' column are enabled but the column is grayed out, indicating that the gain setting must be configured elsewhere in the GUI (in this case on the ''AnalogSignal'' tab). Tooltips describing CSRA bit values can be viewed by hovering the mouse over the column headings.
- The CSRA configurable CSRA bits and their meanings are summarized in the table below. CSRA bits are "enabled" (1) when the corresponding box is checked and "disabled" (0) when the corresponding box is not checked.
| Bit # | Column heading | Description | Details |
|---|---|---|---|
| 0 | FTrS | Channel fast trigger selection | Enabled: Use fast trigger from system FPGA Disabled: Use local fast trigger |
| 1 | ETrS | Module validation trigger selection | Enabled: Module validation trigger from front-panel LVDS connector Disabled: Validation trigger from the system FPGA |
| 2 | Good | Good channel | Enabled: Enable trigger validation for this channel Disabled: Disable trigger validation. Disabled channels still generate fast triggers which can participate in e.g. coincidence logic but the channel data will not be recorded. |
| 3 | CTrS | Channel validation trigger selection | Enabled: Channel validation trigger from front-panel LVDS connector Disabled: Validation trigger from the system FPGA |
| 4 | Sync | Synchronous data acquisition level | Enabled: Disable acquisition if any trace or header DPM on this module is full Disabled: Disable acquisition only if channel trace or header DPM is full |
| 5 | SPol | Signal polarity | Enabled: Invert input signal Disabled: Do not invert input signal
|
| 6 | Veto | Channel veto | Enabled: Enable channel veto with either the module veto (if bit 20 is enabled) or channel veto signal (if bit 19 is enabled) Disabled: Disable channel veto |
| 7 | HistE | Histogram pulse energy | Current Pixie-16 firmware always histograms pulse energy in the onboard MCA memory. This bit is currently not used. |
| 8 | Trce | Trace acquisition | Enabled: Write trace data Disabled: Do not write trace data
|
| 9 | QDC | QDC sums | Enabled: Write QDC sum data Disabled: Do not write QDC sum data.
|
| 10 | CFD | Digital CFD | Enabled: Enable the digital CFD Disabled: Disable the digital CFD |
| 11 | MTrV | Module validation trigger | Enabled: Require coincidence between module validation trigger and local channel fast trigger Disabled: No coincidence requirement |
| 12 | ES | Energy sums | Enabled: Write energy sum data Disabled: Do not write energy sum data
|
| 13 | CTrV | Channel validation trigger | Enabled: Require coincidence between channel validation trigger from channel multiplicity setting and the local channel fast trigger Disabled: No coincidence requirement |
| 14 | HiG | Gain | Enabled: High gain mode (x4) Disabled: Low gain mode (x1)
|
| 15 16 | PC1 PC2 | Pileup control bit 1 Pileup control bit 2 | 00: Record all events 01: Only record single events, reject pileup 10: Only record event header for pileup events (no trace) 11: Only record pileup events |
| 17 | ECut | Energy cut for trace rejection | Not implemented. |
| 18 | GTrs | Channel fast trigger selection | Not implemented. |
| 19 | CVtS | Channel veto selection | Enabled: Channel veto from the system FPGA Disabled: Channel veto from the front-panel LVDS connector
|
| 20 | MVtS | Module veto selection | Module veto from the system FPGA Disabled: Module veto from the front-panel LVDS connector
|
| 21 | EnTS | External timestamp | Enabled: Record external clock 48-bit timestamp in the event header for list-mode runs Disable: Do not use external clock for timestamp
|
The Baseline tab
- The Pixie-16 modules measure the channel baseline when no pulse is present and stores a running average of the baseline value which is subtracted from the energy filter output prior to determining the pulse energy. If measured baselines differ from this average by "BaselineCut" they are rejected and not added to the running average. The automatic baseline adjustment routine run when clicking the [Adjust offsets] button on the "AnalogSignal" tab will set the baseline value to "Baseline %" of the maximum ADC range as well as automatically determine the value of "BaselineCut." It is generally recommended to keep both of these parameters at their default values.
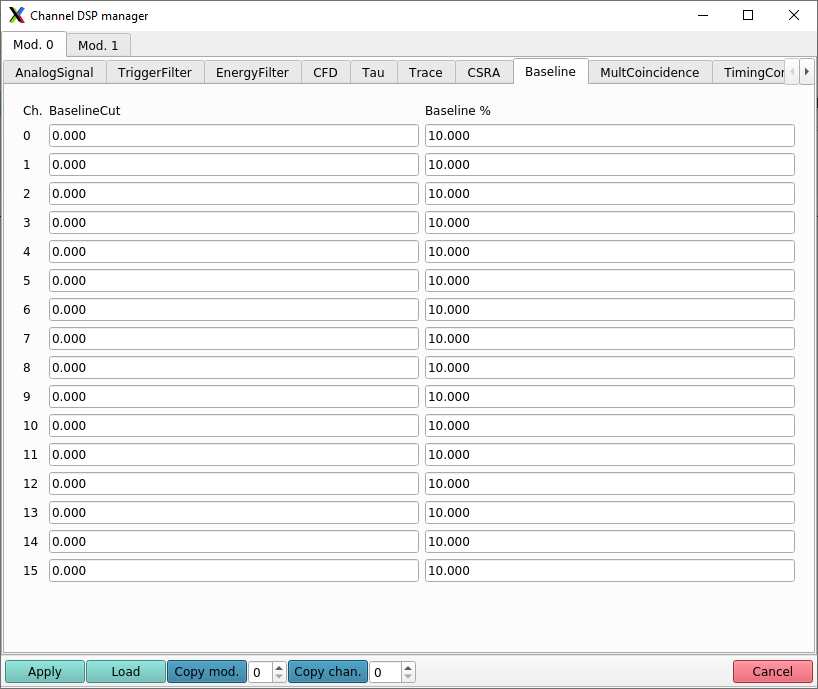
The Baseline Tab.
The MultCoincidence Tab
- Six options are provided to the user to set the groupings of channels on a Pixie-16 module: 8x2, 5x3, 4x4, 2x8, and 1x16. The meaning of, for example, 8x2 is that there are eight groups of 2 channels in pairs: (0, 1), (2, 3), (4, 5), ... , (14, 15). The other groupings follow an analogous scheme, though 5x3 is slightly different because it only groups 15 of the 16 available channels; the 16th channel on the module is left to freely trigger. The "Channel grouping" button will be set to "Unknown" if the coincidence masks which define the channel grouping are not recognized as one of the supported modes. In this case, it is likely that the DSP settings file used to boot the modules is corrupted.
- The "Coincidence settings" box allows the user to set parameters which determine how to read out grouped channels in coincidence. "Channel coincidence width [us]" defines the coincidence window for the channel grouping in microseconds and the "Minimum multiplicity to trigger" sets the minimum number of fast triggers required in each group [0, 1, ..., n-1] for an n-channel grouping. If the corresponding trigger validation CSRA bits for all channels on this module are checked, the "Channel validation" will display "Enabled" in green text, if all are disabled it will display "Disabled" in red text, and if trigger validation is only enabled for some channel groups on the module the text will show "Custom" in yellow.
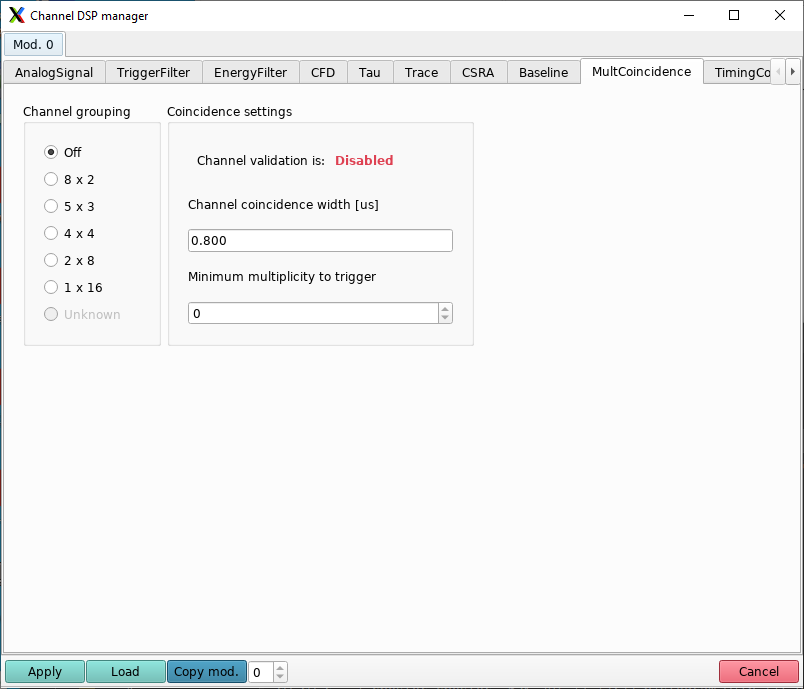
The MultCoincidence tab.
The TimingControl Tab
- Pixie-16 modules implement two-stage trigger logic to determine whether a particular channel will produce data which can be read out. The first stage of this process will generate a fast trigger on the module. At the second, or validation stage, the internal fast trigger is checked against some set of validation criteria. Validation criteria are configured using the channel CSRA and module CSRB settings and can include, for example, validation of a fast trigger with respect to an external validation trigger, a channel grouping coincidence requirement or an internally generated gate. If the fast trigger is validated, the associated data is accepted to be read out, otherwise it is dropped.
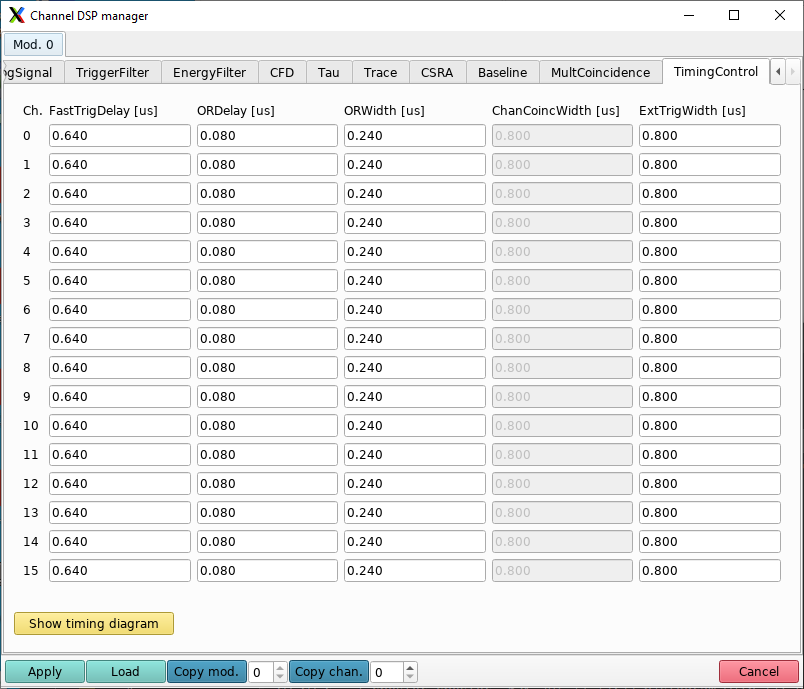
The TimingControl tab.
- To configure the relative timing between the module fast triggers and the validation signal, the "TimingControl" tab provides a set of controllable timing parameters. Clicking the [Show timing diagram] button will display the following graphical representation of the timing parameters in a popup window:
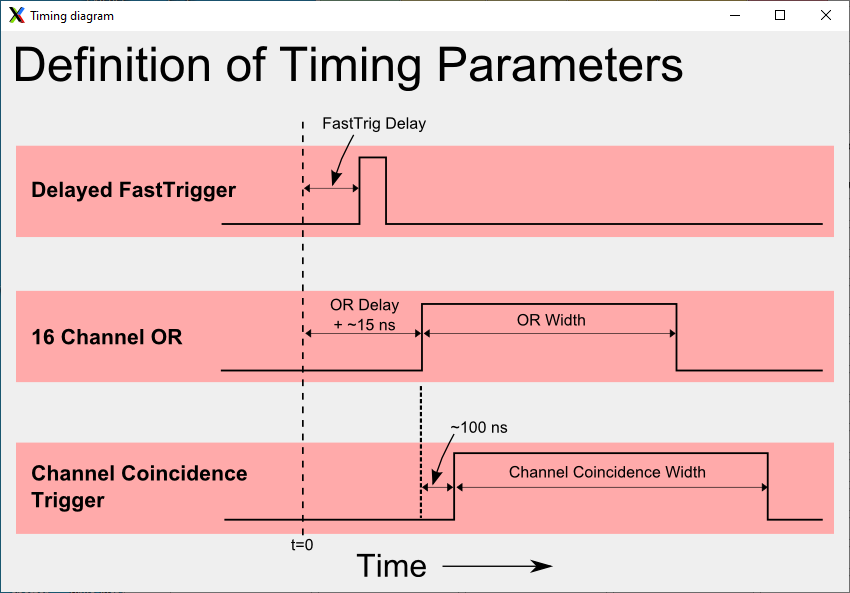
A visual representation of the various timing parameters configurable on this tab. To show this diagram, click the [Show timing diagram] button. The nominal fast trigger point for the hit is given by the dashed vertical line at t = 0.
- The function of the timing control parameters can be inferred from the diagram. Two details are worth mentioning: the first is that the "ChanCoincWidth [us]" parameter is not configurable on this tab. This DSP parameter sets the coincidence window for channel validation and is set on the MultCoincidence tab where other channel validation parameters are controlled. Secondly, the analogous setting for an external validation trigger is "ExtTrigWidth [us]" which functions similarly to the "Channel Coincidence Trigger" shown on the diagram.
- A complete description of the Pixie-16 multiplicity and coincidence triggering scheme is beyond the scope of this guide. It is recommended to refer to the Pixie-16 User Manual, specifically Sec. 3.3.11 and Appendix A.
Configuring Module DSP Settings
- As described in the QtScope GUI section, clicking the [Module DSP] button on the system toolbar displays a popup window allowing the user to configure module-level parameters.
The module DSP popup window displayed when clicking the [Module DSP] button.
The Crate Settings Box
- The crate settings box contains a spinbox which allows the user to set the crate ID for all modules in the crate at once. The value of the crate ID set in the spinbox will be applied to all modules when the [Apply] button is clicked.
The Crate Configuration Box
- The crate configuration box allows the user automatically configure the module CSRB ("Module Control Register B") settings by selecting one of a number of pre-configured crate definitions from a list. These pre-defined crate settings represent the most common use cases encountered in the laboratory:
- Single crate – A single-crate system, the crate is operating standalone. The most common use case in the laboratory.
- Multicrate (director) – The director crate in a multi-crate system. The director crate supplies the clock to the rest of the system. In a multi-crate system there should be only one crate configured as the director.
- Multicrate (chassis) – A chassis crate in a multi-crate system. These crates are configured to receive a clock from the director.
- Custom – Custom CSRB settings. In most cases it is not necessary to configure custom CSRB settings. Please refer to the Pixie-16 User Manual for custom applications. Clicking the [Display CSRB] button will show a graphical representation of the CSRB bits, similar to CSRA tab are displayed:
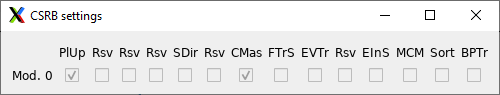
The CSRB settings for the current crate, shown after clicking the [Display CSRB] button. Each row contains a complete set of CSRB settings for a single module. Tooltips describing CSRB bit values can be viewed by hovering the mouse over the column headings. In order to directly manipulate the CSRB bit values, the ''Custom'' setting must be selected from the configuration list.
The Trigger Configuration Box
- Different trigger operation modes can be set in the "Trigger configuration options" box. This box provides an interface which allows users to configure the TrigConfig0 register on the Pixie-16 module. Only two options are given: the default option, where all channels are self-triggering and a "Custom" option where the TrigConfig0 register is fully user-controlled. The status of the TrigConfig0 register can be viewed by clicking on the [Display TrigConfig] button; more information about the configurable options is given in mouse-over tooltips for each setting and in the Pixie-16 User Manual.

The user interface to the TrigConfig0 register. Each row contains a complete set of TrigConfig0 settings for a single module. Tooltips describing the configurable settings can be viewed by hovering the mouse over the column headings. In order to directly manipulate the TrigConfig0 register, select the ''Custom'' setting from the configuration list.
- The most common use case at the lab for configuring custom TrigConfig0 settings is to enable or disable outputs on the front panel LVDS of a module. In order to enable the front-panel output for a module, set the "TsEn" value for that module to "Enabled" and select a channel from the "TsCh" drop-down menu to send to the digital output.